Fig. 2.
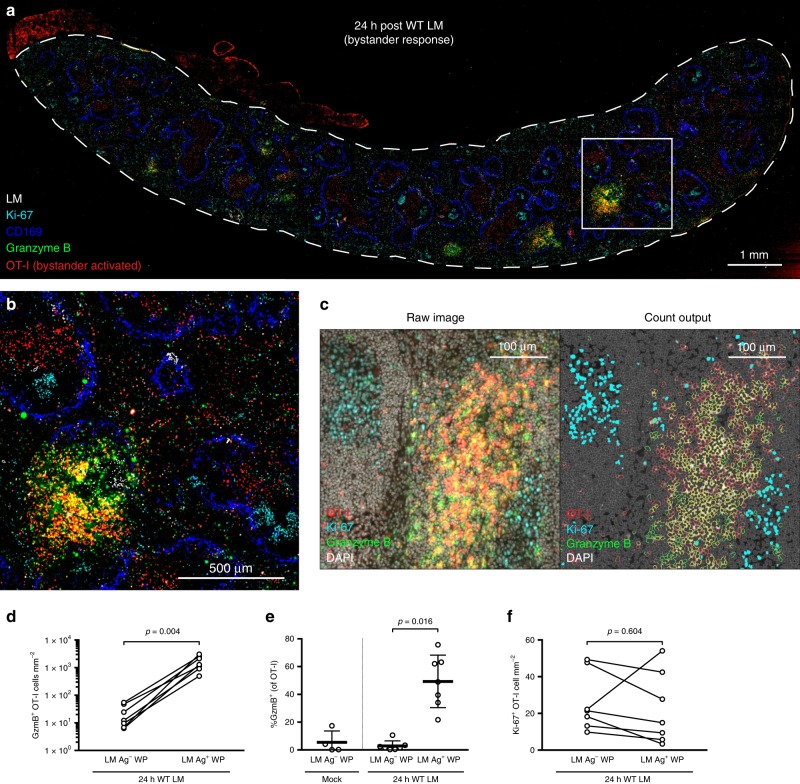
Bystander-activated OT-I T cells form clusters without proliferating. a, b Representative image of spleen 24 h post WT LM immunization from serially sectioned 8 µm slides stained for LM (white), CD169+ MMM (blue), OT-I (red), granzyme B (green), and Ki-67 (cyan). c Raw IF images showing OT-I (red), Ki-67 (cyan), granzyme B (green), and DAPI (gray), and cell identity outputs used for cell enumeration (OT-I, red; granzyme B, green; OT-I and granzyme B co-staining, yellow; Ki-67+ nuclei, cyan; Ki-67− nuclei, gray) from HALO digital pathology software. d–f Enumeration of cell densities and frequencies from HALO-analyzed IF images. d Density of granzyme B+ OT-I cells amongst splenic WP stained for the absence (LM Ag–) or presence (LM Ag+) of WT LM 24 h after immunization. e Frequency of granzyme B expression in OT-I T cells within WP from unimmunized animals (Mock) and WP from animals 24 h post WT LM immunization (24 h WT LM), stratified by presence of LM Ag (LM Ag–, LM Ag+). f Density of Ki-67+ OT-I T cells amongst splenic WP absent or containing LM Ag 24 h after WT LM immunization. In a, b image is representative of n = 7 spleens. Contrast was increased and tissue orientation was modified in Adobe Photoshop to overlay serially sectioned slides. LM Ag staining was outlined to increase visibility using “find edges” in ImageJ; after, all channels were merged using ImageJ. In d–f each symbol (mock immunization) or connected symbol pair (24 h post WT LM immunization) represents one animal from three experiments (n = 4 mock-immunized, n = 7 WT LM-immunized). Indicated are statistical significances by Wilcoxon matched-pairs signed rank test. See also Supplementary Fig. 3. Source data are provided as a Source Data file

