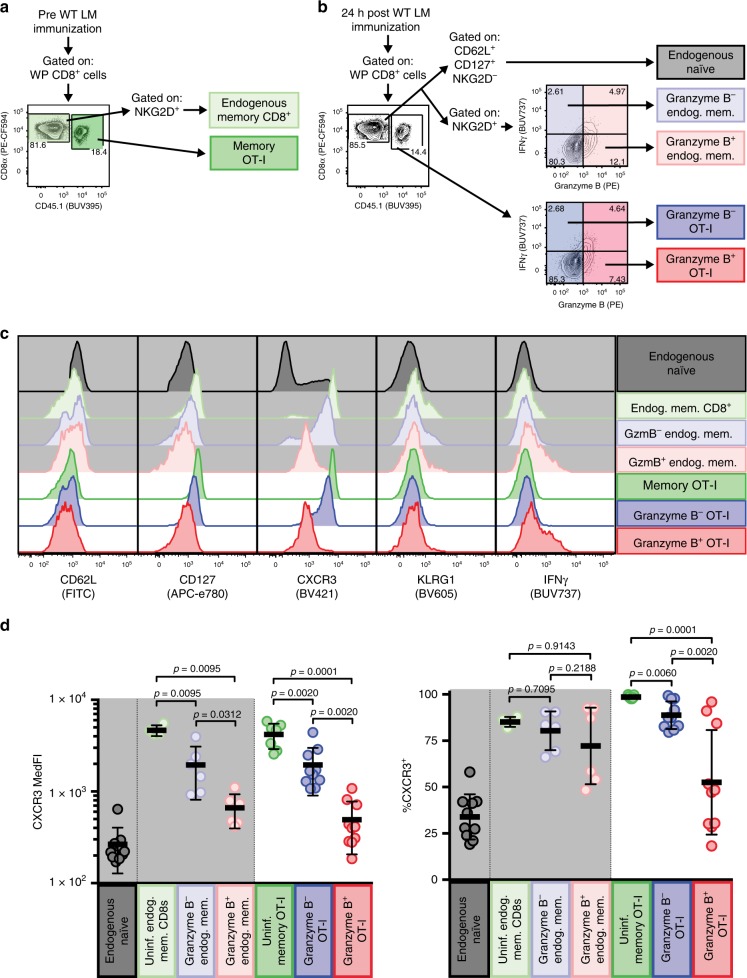
Fig. 4.
Bystander-activated T cells display a decrease in CXCR3 cell surface expression. a, b Representative flow plots showing gated populations used for representative overlays in c and frequencies and median fluorescence intensity (MedFI) reported in d. a Representative flow plot from LM-uninfected OT-I memory white pulp (WP) splenocytes showing gating strategy for endogenous memory CD8+ T cells (light green) and memory OT-I T cells (green). b Representative flow plot from OT-I memory WP splenocytes 24 h post WT LM infection, showing gating strategy for endogenous naive CD8+ T cells (gray), granzyme B+ (i.e., bystander-activated) and granzyme B− endogenous memory CD8+ T cells (light red and light blue, respectively) and OT-I T cells (red and blue, respectively). c Flow histogram overlays of populations outlined in a, b for phenotypic and functional markers. Cells endogenous to hosts have a light gray background. d CXCR3 MedFI and CXCR3+ frequencies of populations outlined in a, b. b is a representative plot from n = 3 animals concatenated into a single file. c is a representative plot from concatenated populations shown in a, b. In d a single point represents a specific population from each animal (n = 6 for endogenous memory populations and 10 for transgenic and endogenous naive populations) from three experiments. Summary statistics shown are mean ± SD. Indicated are statistical significances by Wilcoxon matched-pairs signed rank test. See also Supplemental Fig. 6. Source data are provided as a Source Data file

