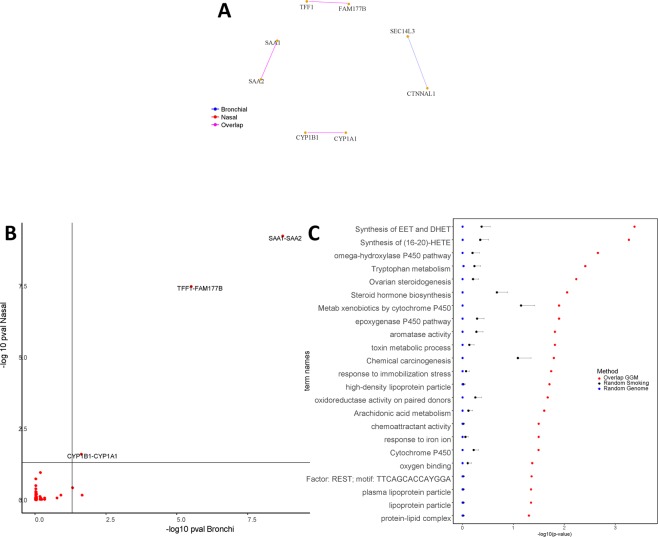
Figure 4.
Network analyses for the smoking (SM) genes. (A) GGM network for the SM genes (BH ). Genes which had no significant connections (partial correlation) were left out of the figure, and the genes connected in only one of the tissues are colored in grey. In blue: edges present in bronchial tissue. In red: edges present in nasal tissue. In magenta: edges present both tissues (Overlapped edges). (B) Scatter plot of the GGM network edges (partial correlation) for the SM genes. Each red dot represents of an edge in bronchial tissue (horizontal axis) versus nasal tissue (vertical axis). In light black: the critical value at BH The figure displays the respective gene pairs for the most similar edges. (C) 22 significant GOs for the set of Overlapped genes. The enrichment is contrasted against two sets of genes randomly sampled from the SM (27 genes) and from the whole genome (19718 genes). The panel displays the corresponding mean (p-values), and error bars represent + 2 standard errors over the 500 random samples.

