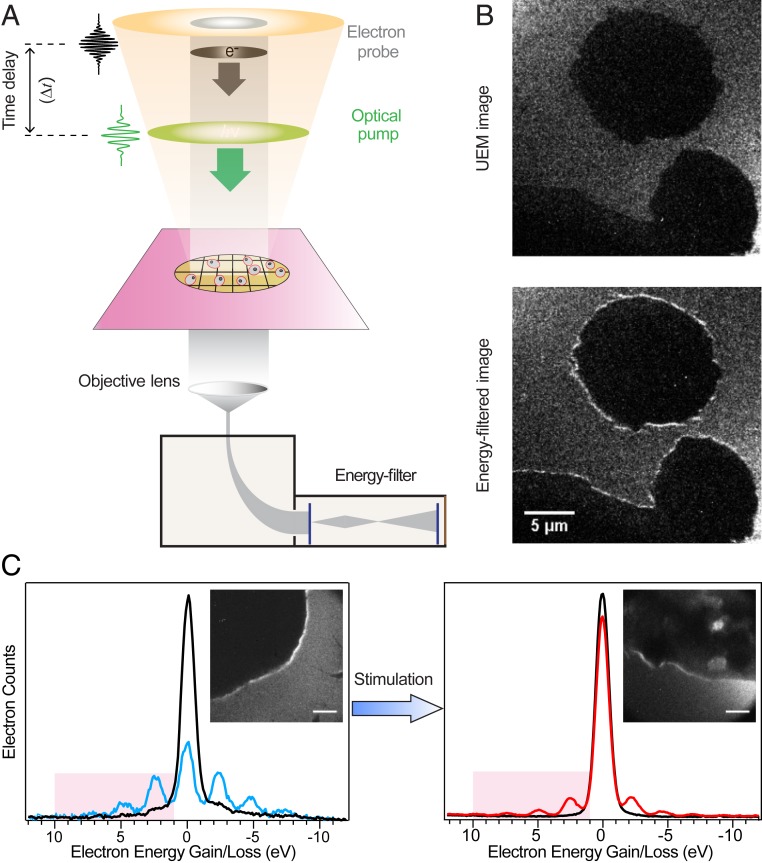
Fig. 1.
Time-resolved PINEM on T cells. (A) Scheme depicting the basic components of PINEM imaging. A packet of probing electrons (gray) and a fs laser pulse (green) are directed to the cells. At the cell surface, some of the electrons gain or lose integer number of photon energy quanta. An energy filter is used to retain the electrons that gained energy, which are used to generate a PINEM image. (B) Representative UEM (Top) and PINEM (Bottom) images of Jurkat T cells. (C) Electron energy spectra of Jurkat T cell without (blue) or with (red) T cell activation (CD3/CD28/CD2) treatment and their corresponding PINEM images (Inset), showing the relative difference in contrast. Both spectra are measured at zero time delay, while spectra with zero loss peaks (black) are measured at +1 ps time delay. Electron energy gain equivalent to 1 to 4 photon quanta is highlighted (2.4 to 9.6 eV). (Scale bars: 1 μm.)

