Fig. 5.
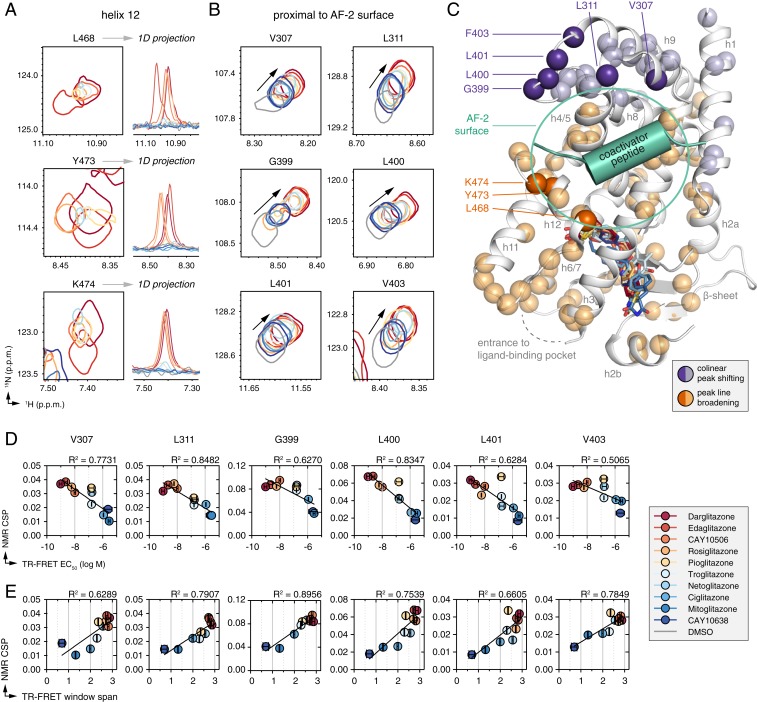
NMR-detected changes in the PPARγ LBD conformational ensemble correlate with graded ligand potency and efficacy. (A and B) Snapshots of [1H,15N]-TROSY-HSQC NMR spectra of 15N-labeled PPARγ LBD that show NMR changes as a function of graded potency and efficacy, including residues (A) in helix 12 that show NMR peak line broadening, along with 1D projections; or (B) proximal to the AF-2 coactivator interaction surface that show colinear shifting. (C) Analysis of all well-dispersed NMR peaks with reasonable peak separation that could be faithfully analyzed shows widespread correlations throughout the PPARγ LBD that group into 2 surfaces sensitive either to NMR peak line broadening or colinear shifting. The dark orange and dark purple spheres correspond to residues shown in A and B; the light orange and light purple spheres correspond to other residues that also show line broadening (SI Appendix, Fig. S5) or colinear shifting (SI Appendix, Fig. S6) in the TZD series. (D and E) Plot of NMR chemical shift perturbation for each liganded state shown in B relative to the apo-protein state vs. (D) ligand potency from Fig. 2D and (E) ligand efficacy in the TR-FRET coactivator recruitment assay from Fig. 2E fit with a linear regression equation.

