Fig. 2.
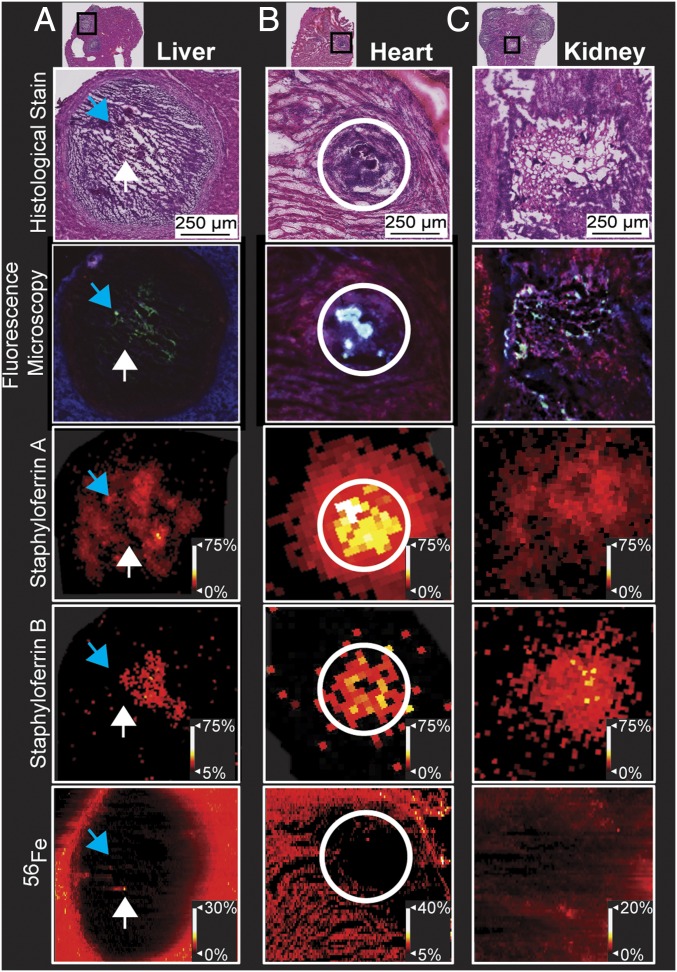
Multimodal imaging of 10-DPI S. aureus PisdAgfp infection characterizes utilization of SA and SB across tissue types. (A) Siderophore distributions localize to regions of staphylococcal Fe starvation (blue arrows). Fe distributions colocalize to areas that lack GFP signal in the fluorescent micrograph (white arrows). (B) Siderophore distributions in the heart expand outside of the abscess. (C) Heterogeneity in siderophore and Fe distributions as well as Fe starvation can be observed from zooms of a single kidney abscess, similar to distributions within the liver.

