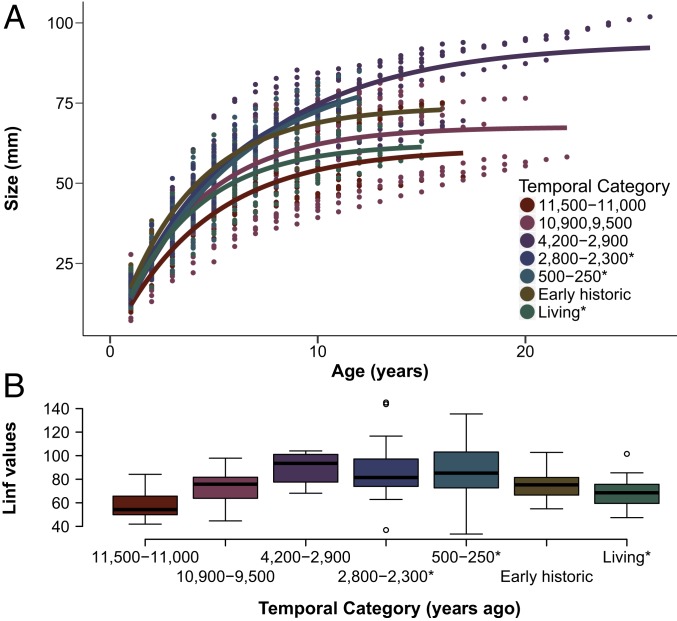
Fig. 4.
Modeled growth of butter clams from 7 temporal categories. (A) Average von Bertalanffy growth curve per time period. Curves have been forced through 0. (B) Boxplots showing L∞ by temporal category with model forced through 0 for each individual specimen (total sample = 124 clams; sample size in each temporal period varies between 11 and 30 depending on temporal context) (SI Appendix, Table S3). *Harvested clams collected from middens and from modern (living) populations.

