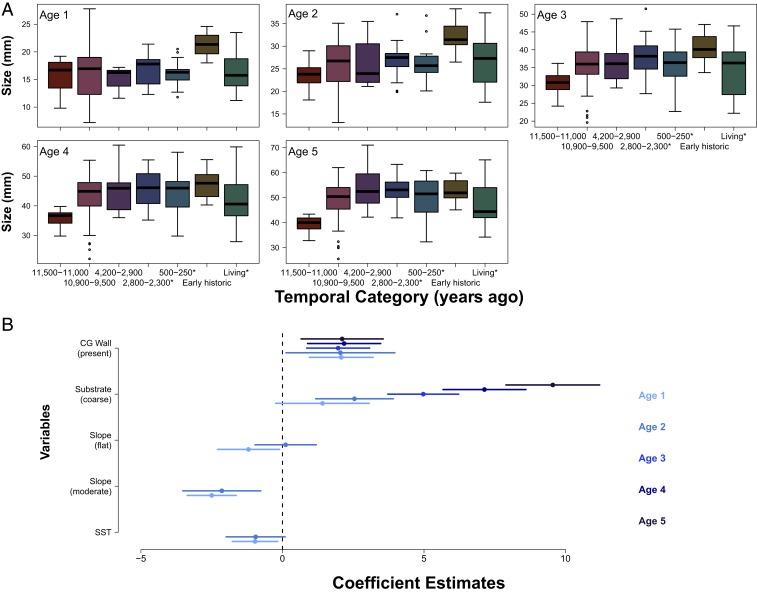
Fig. 5.
Size (millimeters) at ages 1 to 5 (A) across temporal categories and model average coefficient estimates and SEs showing the factors affecting size at age (B), where age of clam is indicated from light to dark blue. Note different ranges on y axes in A and that slope and SST are not included in the model average for ages 3 to 5 clams. CG Wall indicates that a clam garden wall is present. *Clams collected from midden and living samples.

