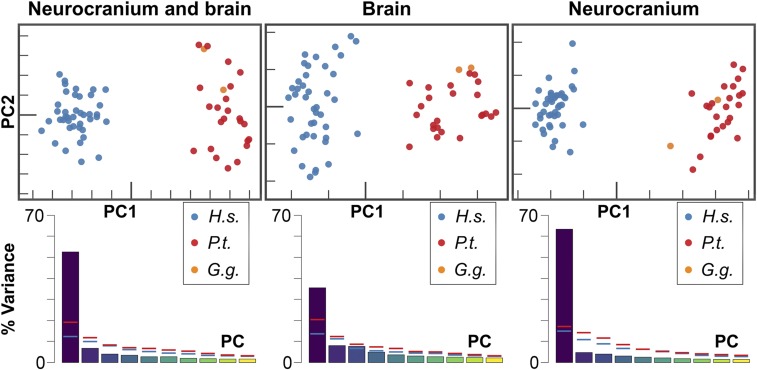
Fig. 2.
Principal component analysis of neurocranium+brain, brain, and neurocranium shape variation in humans (blue) and chimpanzees (red). Data of 2 gorillas (orange) were projected into the human–chimpanzee shape space. H.s., Homo sapiens; P.t., Pan troglodytes; G.g., Gorilla gorilla. Within each graph, PC1 and PC2 axes are shown using the same scale. Scree plots show the percentage of variance explained by the first 10 PCs in the pooled sample of humans and chimpanzees (bars), as well as in human (blue horizontal lines) and chimpanzee (red horizontal lines) samples.

