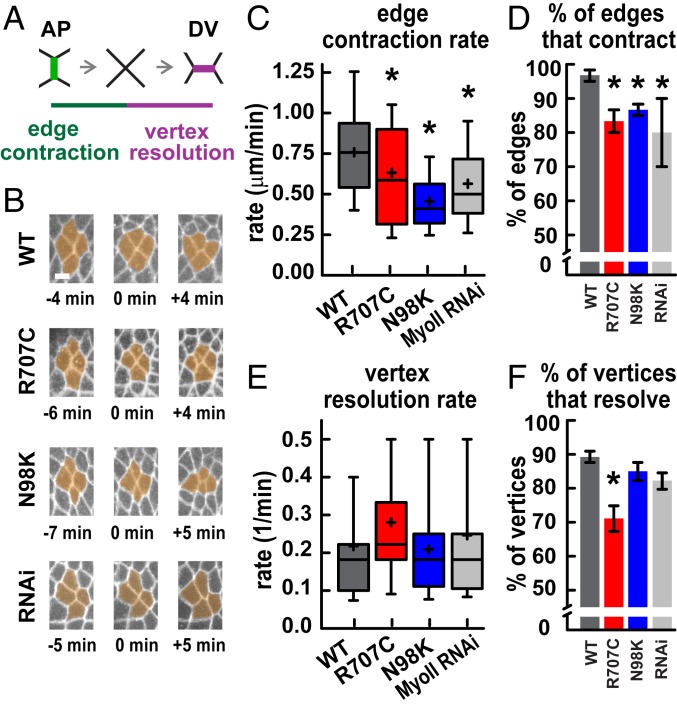
Fig. 5.
Myosin II motor variants produce slowed cell intercalation. (A) Schematic of cell intercalation. (B) Stills from movies showing cell rearrangements, with time indicated relative to vertex formation. (Scale bar: 5 μm.) (C) AP edge contraction rates were decreased in MyoII-R707C, MyoII-N98K, and MyoII RNAi embryos compared with MyoII-WT. *P < 0.05, t test. Edge contraction was slower in MyoII-N98K than MyoII RNAi (P = 0.05) (t test). (D) The percentage of AP edges that completed contraction was decreased in MyoII-R707C, MyoII-N98K, and MyoII RNAi embryos compared with MyoII-WT. *P < 0.05, χ2 test. (E) Vertex resolution rates were not significantly different in all genotypes. P > 0.1, t test (τ = time for a vertex to resolve to form a new edge >1 μm in length; 1/t = vertex resolution rate). (F) The percentage of vertices that resolved directionally to form DV edges was decreased in MyoII-R707C compared with MyoII-WT. *P < 0.05, χ2 test. In C and E, the boxes indicate the 25th to 75th percentiles, with a line at the median, and the whiskers indicate the 10th to 90th percentiles. Mean, plus sign. In D and F, data are mean ± SEM between embryos. In C and D, there are 3 embryos per genotype and 20 edges per embryo; in E and F, there are 4 to 5 embryos per genotype and 15 to 24 vertices per embryo.

