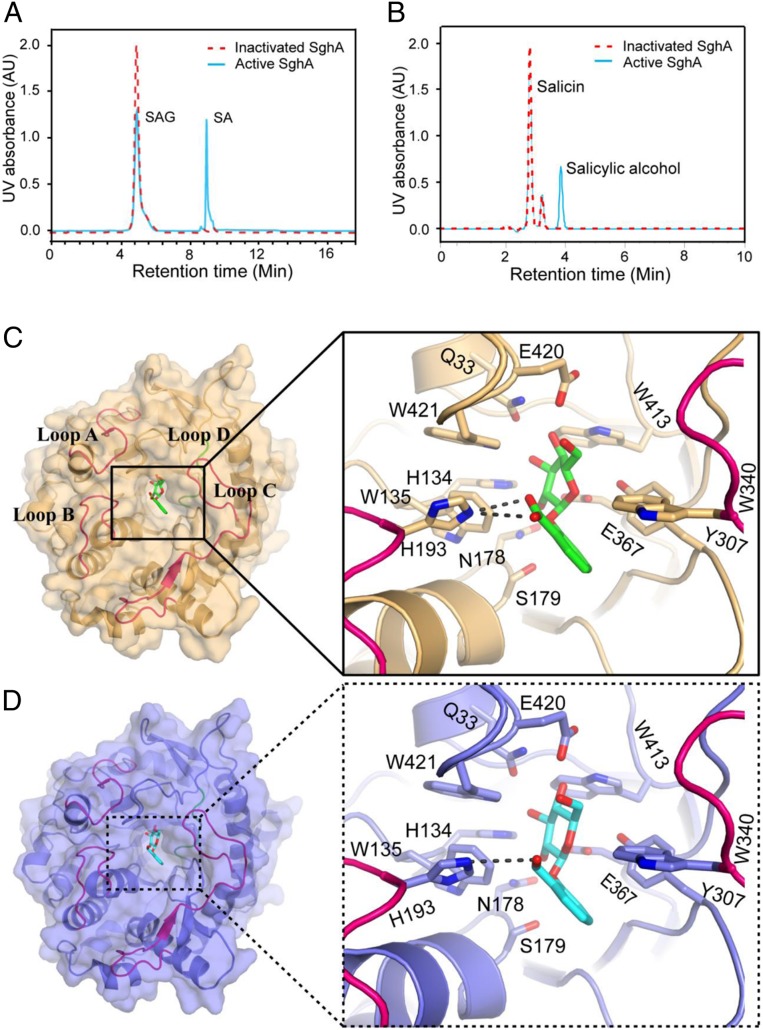
Fig. 2.
SghA releases SA from SAG. (A) HPLC profile of reaction mixtures containing SAG treated with SghA (blue) and denatured SghA (red). (B) HPLC profile of reaction mixtures containing salicin treated with SghA (blue) and denatured SghA (red). HPLC experiments were repeated at least 3 times, and 1 set of representative data is presented. AU, arbitrary unit. (C) Catalytic site of SghA in the presence of SAG. SAG is shown as a stick, and carbon and oxygen atoms are colored green and red, respectively. Residues involved in SAG binding are shown as a stick model. Hydrogen bonds between His216 of SghA and SAG are indicated by a dashed line. Loops A to D (residues 54 to 69, 189 to 200, 314 to 344, and 365 to 384, respectively) are colored red and blue (loop D only) (same as in D). (D) Binding pocket of SghA in the presence of salicin. Salicin is shown as a stick, and carbon and oxygen atoms are colored cyan and red, respectively. Residues interacting with salicin are shown as a stick model. The hydrogen bond between His216 of SghA and salicin is indicated by a dashed line.

