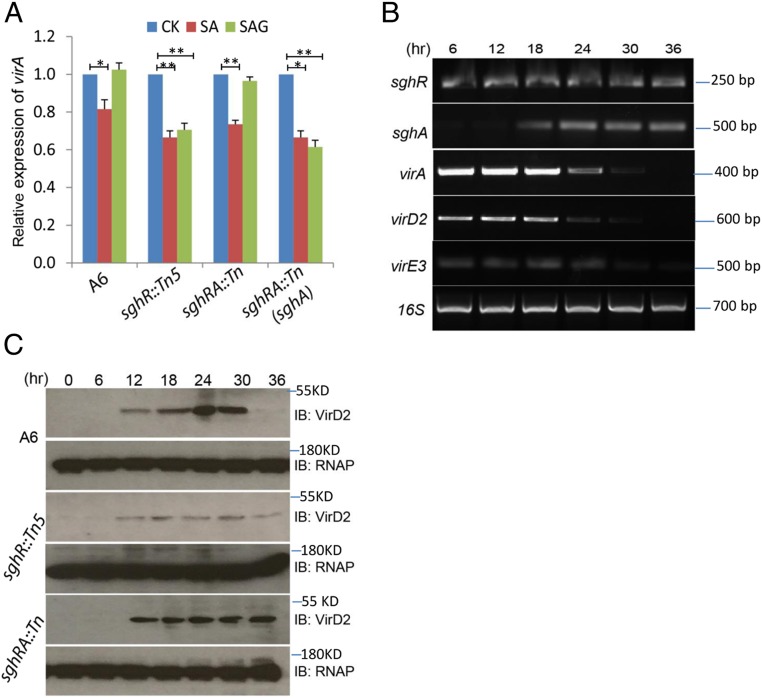
Fig. 6.
SghA-releasing SA down-regulates vir gene expression of A. tumefaciens during plant infection. (A) Real time RT-PCR analysis of virA expression in the presence of SA and SAG, respectively. The virA expression level in blank control without treatment (CK) was arbitrarily set as 1. The error bar denotes the SD of 3 repeats. Experiments were repeated 3 times in duplicate. Statistical analyses were performed with a nonparametric 1-way ANOVA test in GraphPad. *significant < 0.05; **significant < 0.01; ns, not significant. (B) In planta expression patterns of sgh and vir genes of A. tumefaciens strain A6. The 16S rRNA was amplified as an internal control. (C) Western blot analysis of VirD2 in planta expression patterns using VirD-specific antibody. Expression levels of bacterial RNA polymerase (RNAP) were determined with beta subunit RNAP-specific antibody as a loading control. IB, immunoblot. KD, kilodalton.

