Fig. 2.
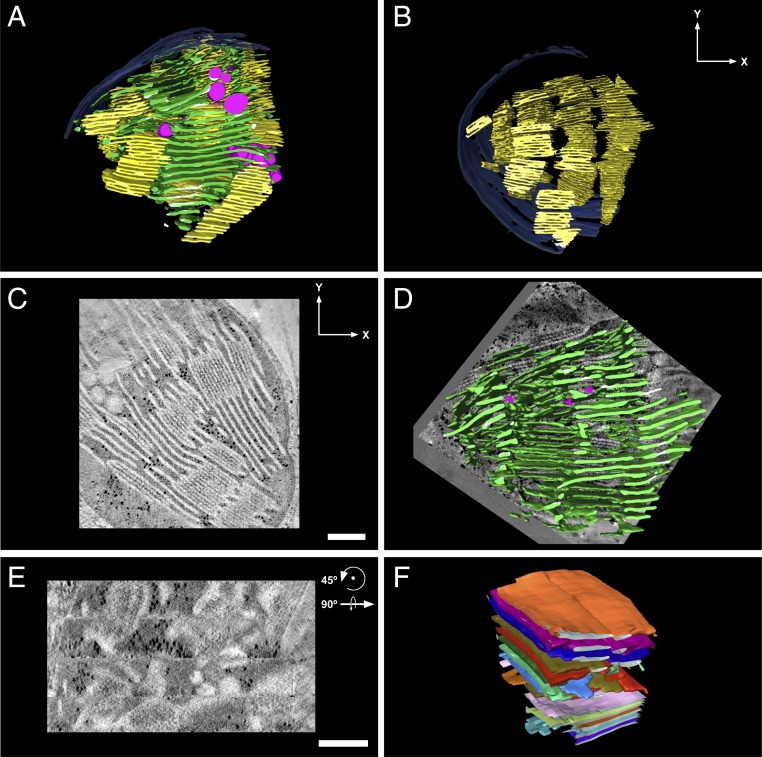
Overall network architecture and domain organization. (A) A 3D model of a dark-adapted lettuce thylakoid network generated by segmentation of a tomographic reconstruction by TEM. The grana and stroma thylakoids are colored yellow and green, respectively; the chloroplast envelope is shown in blue and the magenta-colored inclusions associated with the thylakoids are plastoglobules. (C and D) Tomographic slices ∼10 nm thick presented approximately perpendicular (C) and parallel (D) to the plane of the grana thylakoids. The 4 horizontal segments apparent in D correspond to the 4 serial sections that constitute the tomogram. Models showing (B) only grana stacks, to enable visualization of grana piling into columns, (E) only stroma lamellae (superimposed on a ∼10-nm-thick tomographic slice), to enable visualization of the sheets, cross-overs, and bifurcations, and (F) a group of stroma lamellar sheets with each individual sheet displayed in a different color, depicting the parallel organization of the sheets. (Scale bars, 250 nm.)

