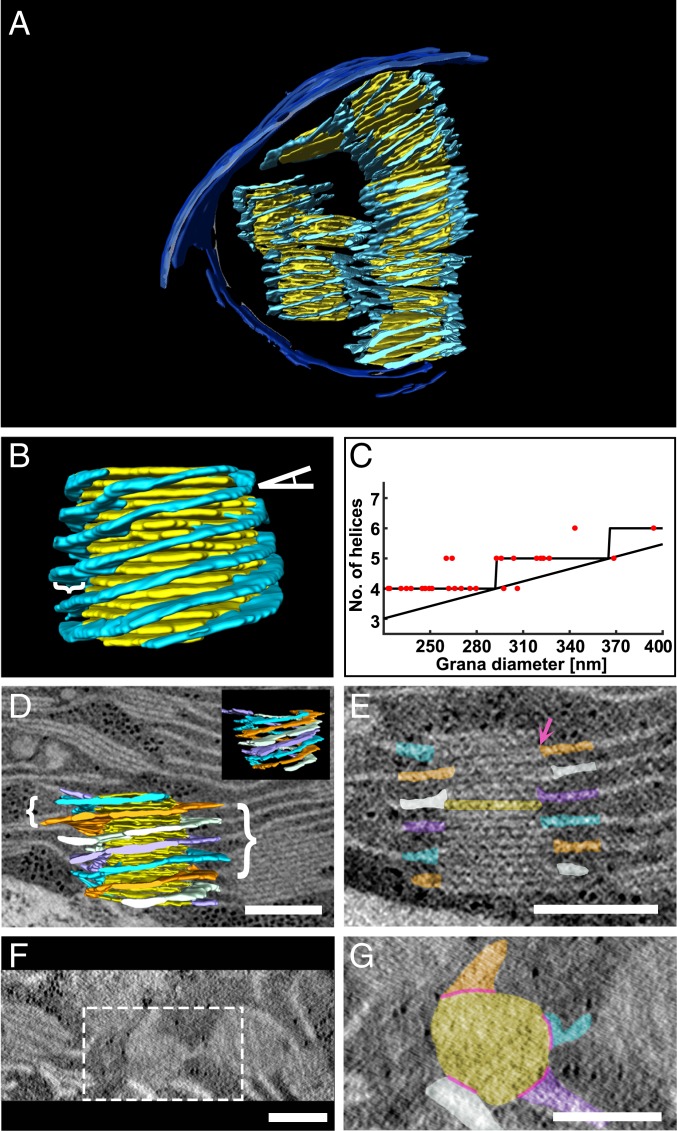
Fig. 3.
Grana are surrounded by multiple right-handed helices. (A, B, and D) A 3D model generated from segmentation of TEM (A) and STEM (B and D) tomographic data consisting of single and multiple grana (yellow) each surrounded by multiple stroma lamellar helices (light blue). In B, the tilt angle of the helices relative to the grana is depicted by an angle symbol on the top right and the width of the helices is depicted by a curly bracket on the left. (C) A plot of the number of helices per granum vs. grana diameter (n = 28). The plot resembles a staircase ceiling function whose bound depends on the tilt angle of the helices, their spacing along the granum cylinder, and the circumference of the grana. As discussed in the text, the first 2 parameters are fairly conserved among grana in the network. In D, the model is shown superimposed on a ∼10-nm-thick tomographic slice with curly brackets showing the uniformity of separation of the helices (left) as well as their pitch (right). (D, Inset) The model is shown from another angle without the superimposed tomographic slice). (E–G) Tomographic slices ∼10 nm thick presented approximately perpendicular (E) and parallel (F and G) to the plane of the grana thylakoids from D. Several grana are shown from the top view (F); the specific granum from D is outlined (white dotted line) and a close-up is provided (G). (D, E, and G) The 4 right-handed helices that surround the granum are separately colored (orange, white, purple, and light blue) to facilitate visualization of their winding along the granum cylinder. (G) The slits connecting between the grana discs and the stroma lamellar helices, referenced in the text, are depicted by pink lines, and one is also shown by a pink arrow in E. The specific granum layer shown in G is also colored yellow in E. (Scale bars, 250 nm.)

