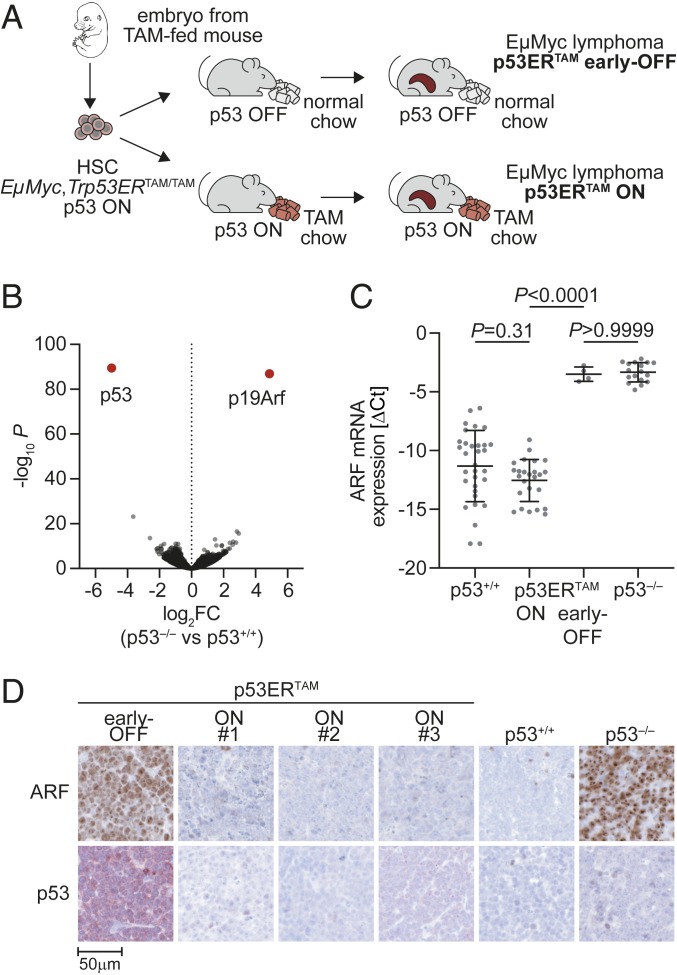
Fig. 1.
Generation of Eµ-Myc;p53ERTAM lymphomas with active p53. (A) Scheme illustrating the experimental outline. HSC, hematopoietic stem cells from fetal liver. (B) Volcano plot depicting fold change in gene expression (log2FC) and significance (−log10P) for Eµ-Myc;p53+/+ and Eµ-Myc;p53−/− lymphomas (n = 4 each). (C) ARF mRNA expression of lymphomas with indicated p53 genotype and activity status. Expression of individual lymphomas is shown normalized to β-actin as ΔCt (mean ± SD, 1-way ANOVA with Tukey’s multiple comparisons test). (D) Immunostaining of ARF and p53 (CM5) for lymphomas with indicated p53 genotype and activity status.

