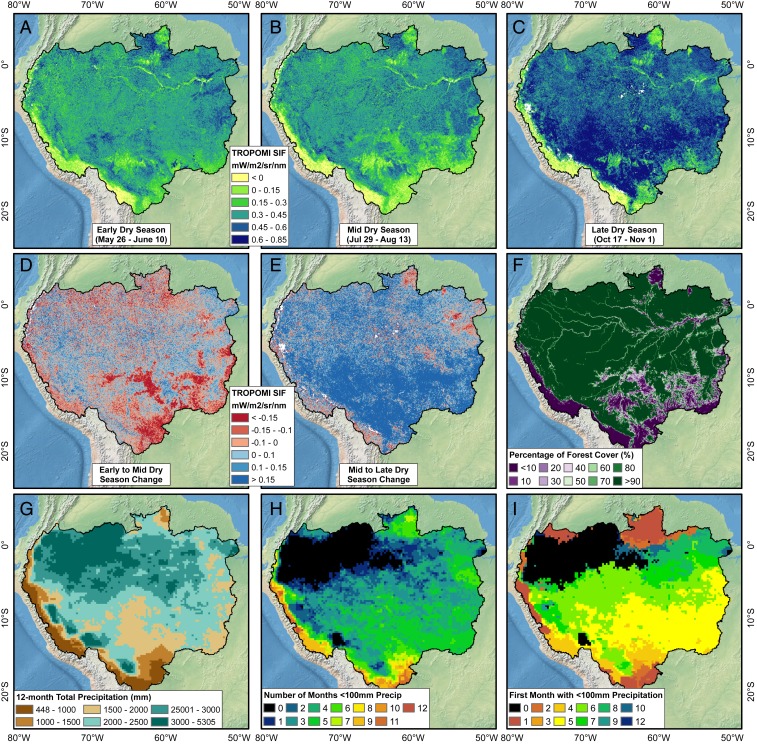
Fig. 1.
SIF, forest cover, and precipitation in the Amazon Basin. SIF during the (A) early, (B) middle, and (C) late dry season. (D) Middle minus early dry-season SIF. (E) Late minus middle dry-season SIF. (F) Percentage forest cover in each TROPOMI 0.05° pixel. (G) Total precipitation March 2018 to February 2019. (H) Number of months with <100 mm of precipitation. (I) First month with <100 mm precipitation.

