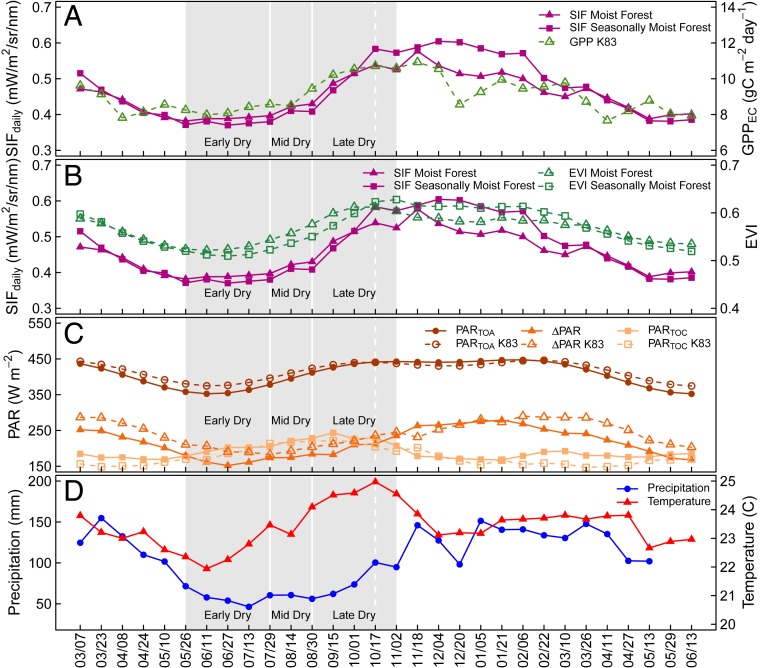
Fig. 2.
Amazon forest SIF, photosynthesis, PAR, precipitation, and temperature. (A) TROPOMI SIF for moist and seasonally moist forest (>2,000 mm and <2,000 mm MAP), and 5-y mean GPP at the K83 moist forest flux tower site. (B) TROPOMI SIF for moist and seasonally moist forest, and BRDF-corrected EVI from MCD43A4 for moist and seasonally moist forest. (C) Basin-wide PAR at the top of the atmosphere (TOA), the top of the canopy (TOC), and the difference between the 2 (∆PAR), and 5-y means of TOA, TOC, and ∆PAR from the K83 flux tower site. (D) Basin-wide mean precipitation and temperature. Points are 16-d means. Shaded areas represent the early, middle, and late dry season. The dashed line approximates when TROPOMI’s phase angles are lowest.

