Fig. 5.
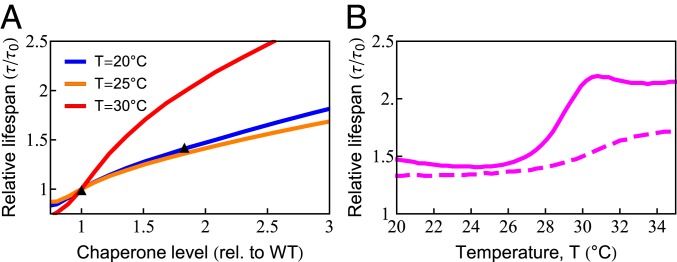
Increased chaperone capacity extends life span. (A) Chaperone dependence of relative (rel.) life span (, where is the life span with wild-type [WT] chaperone level) at T = 20 ○C (blue line), T = 25 ○C (orange line), and (red line). The predicted increase of life span (orange line) quantitatively captures the experimentally observed life span extension at (black triangles) (77). (B) The temperature dependence of life-span extension due to a 2-fold increase in chaperone level with (solid line) and without (dashed line) the ability of chaperones to bind, and thus be titrated by, damaged protein.

