Fig. 1.
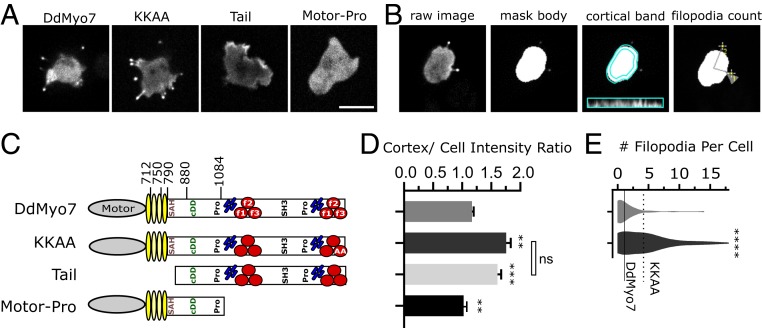
Recruitment to the cortex and release of head–tail autoinhibition promotes filopodia formation. (A) Micrographs of D. discoideum cells expressing GFP-tagged DdMyo7 constructs expressed in myo7 null cells. Note the concentration of GFP-DdMyo7 and the KKAA autoinhibition mutant in the filopodia tip and distinct cortical enrichment of the GFP tail. (Scale bar: 10 μm.) (B) Illustration of the quantitative image analysis pipeline (adapted from ref. 26). Cells expressing GFP-DdMyo7 fusions are analyzed by identifying fluorescent cell bodies and filopodia tips then registering those tips to cells to calculate average number of filopodia per cell. The fluorescence intensity of a 0.8-µm band around the cell periphery is measured and compared to the rest of the cell body to measure cortical targeting. Only cells expressing the fluorescent protein are included in analysis by thresholding. (C) Schematic illustration of DdMyo7 and fragments. N-terminal motor domain (gray oval), light chain binding IQ motifs (yellow ovals), stable α-helix (SAH), candidate dimerization domain (cDD) 2 proline-rich regions (Pro), MyTH4 domains (blue rods), FERM domains (red circles), and a src-homology 3 domain (SH3). Amino acid numbers are indicated above. (D) Graph of cortical band intensity. (E) Violin plot of number of filopodia per cell. Cells expressing the tail or motor fragments lack filopodia and are excluded. (C and D) DdMyo7 and KKAA means are represented by horizontal solid and dashed lines, respectively, for comparison. Significance indicators from Tukey’s test are in comparison to DdMyo7 control, unless otherwise indicated on the graph: ns, not significant; **P < 0.01; ***P < 0.001; ****P < 0.0001.

