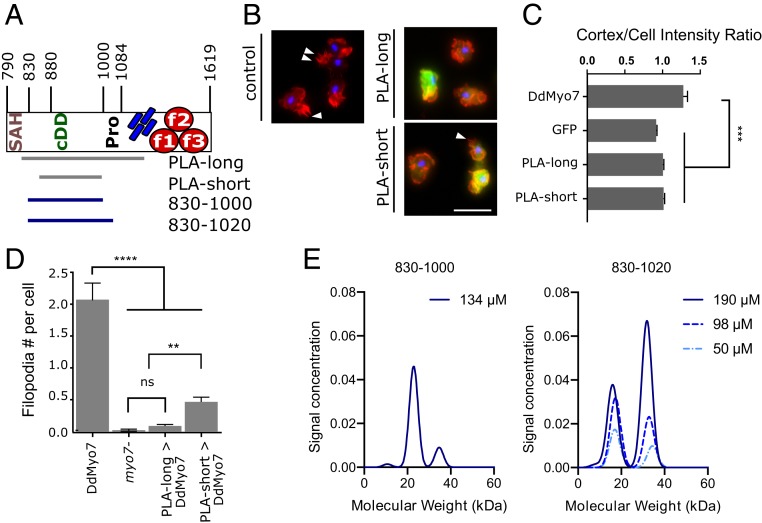
Fig. 3.
The proximal tail domain has a dominant-negative effect on filopodia and weakly dimerizes in solution. (A) Schematic of proximal tail region. Numbers represent amino acid number in the full protein. (B) Representative micrographs of AX2 (control) D. discoideum cells fixed and stained with phalloidin (actin; red) and DAPI (nuclei; blue). (Left) Control untransformed cells. The white arrowheads point to filopodia. (Right) GFP-PLAlong fragment or GFP-PLAshort expression in wild-type cells. (Scale bar: 10 µm.) (C) Cortical band intensity of cells expressing either GFP-DdMyo7, GFP alone, or 1 of 2 different GFP-PLA fragments. (D) Graph of phalloidin-stained filopodia per cell. (E) Graph of molecular-weight distribution of PLA830-1000 (single-concentration run) or PLA830-1000 (3 increasing concentrations) by sedimentation velocity analytical centrifugation. Significance indicators: ns, not significant; **P < 0.01; ***P < 0.001.

