Fig. 4.
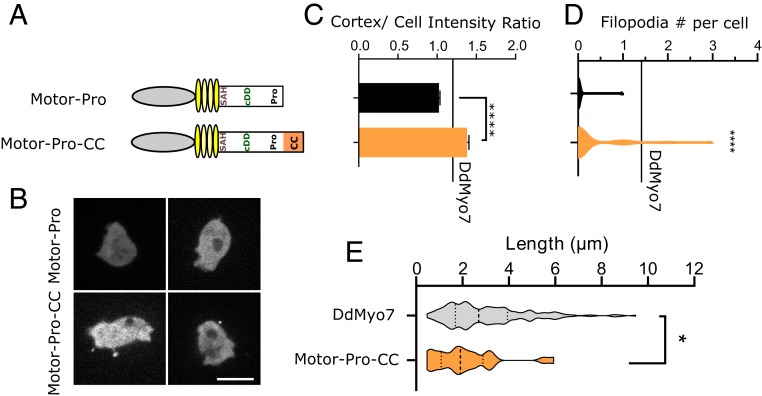
Filopodia formation promoted by a forced dimer of the motor. (A) Schematic illustration of the motor-Pro1 region or forced dimer (CC). (B) Localization of the motor-Pro1 and motor-Pro1-CC motors in myo7 null cells. (Scale bar: 10 µm.) (C) Cortical intensity of expressed motor fragments. Motor-Pro-CC also enriched relative to DdMyo7 control (***, horizontal line). (D) Violin plot of filopodia per cell. The horizontal line represents the mean of DdMyo7 control. (E) Measurement of filopodia length of motor-Pro1-CC compared to the control DdMyo7. Significance indicators from Tukey’s test are in comparison to DdMyo7 control, unless otherwise noted: ns, not significant; *P < 0.05; ****P < 0.0001.

