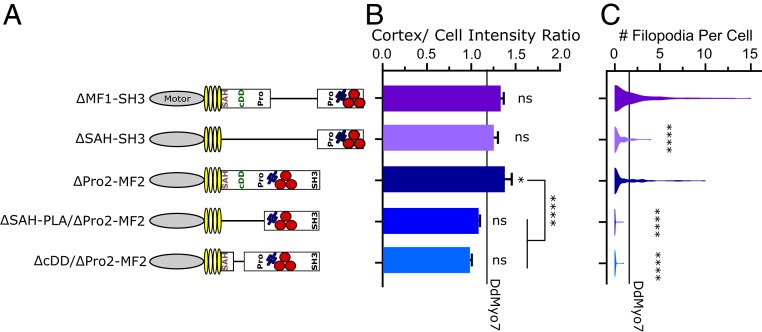
Fig. 5.
Functional cooperation of the proximal tail and MF2 regions. (A) Schematic illustration of proximal tail and MyTH4-FERM double domain mutants. (B) Cortical intensity of tail deletion mutants; significant values are compared to DdMyo7 control (horizontal line). (C) Violin plot of filopodia per cell. The horizontal line represents the mean of DdMyo7 control. Significance indicators from Tukey’s test are in comparison to DdMyo7 control, unless otherwise noted: ns, not significant; *P < 0.05; ****P < 0.0001.

