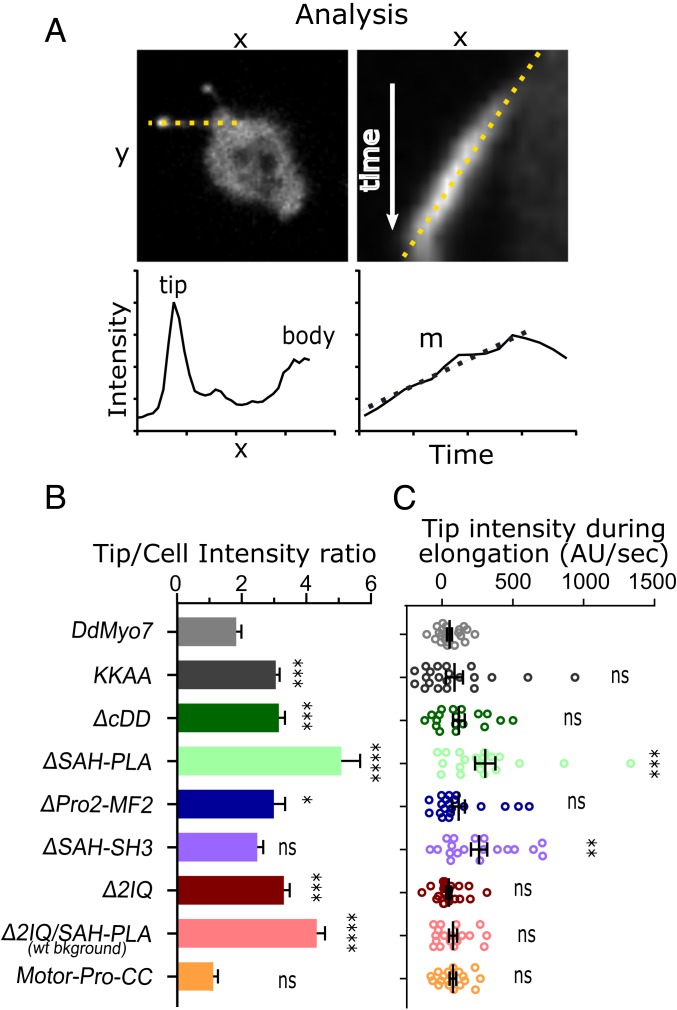
Fig. 7.
Deletion of the proximal tail region causes DdMyo7 accumulation in filopodia tips. (A) Method for analysis of tip intensity during filopodia extension. Shown is a myo7 null expressing ∆SAH-Pro1. (Left Top) Sample micrograph dotted line drawn from the filopodia tip to cell body. Axis labels “x” and “y” are distance units (microns). (Left Bottom) Sample graph representing the fluorescence intensity of GFP-fusion protein along filopodia. The x axis is distance along the length of a filopodia starting and the tip, and y axis represents GFP intensity in arbitrary units. Note the 2 intensity maxima at the filopodia tip and cell body/cortex. (Right Top) Sample kymograph of an elongating filopodium (generated from the line on the Left). The line is drawn along the extending filopodia tip. The x axis is distance (microns), and the y axis is time (seconds). (Right Bottom) Sample graph representing the intensity measurement of the filopodia tip over time from the above kymograph. The x axis is time (seconds), and the y axis is GFP intensity (arbitrary units). (B) Graph of the tip/cell body intensity ratios of GFP-DdMyo7 and mutants. All constructs are expressed in myo7 null cells except for the 2IQ/SAH-PLA mutant that does not rescue filopodia formation and was expressed in the AX2 wild-type strain (noted on graph). (C) Graph of filopodia tip intensity accumulation rates (change in tip intensity during elongation) of GFP-DdMyo7 and mutants. Note that a negative rate indicates the tip gets dimmer. Comparisons are to DdMyo7 control: ns, not significant; *P < 0.05, **P < 0.01; ***P < 0.001, and ****P < 0.0001.

