Fig. 3.
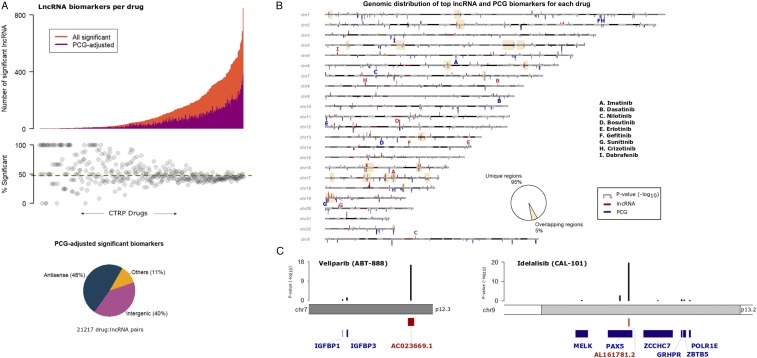
Relevance of cis-PCG adjusted lncRNA biomarkers. (A) Distribution of significant lncRNAs associated with each CTRP drug (X axis). The orange bars indicate a number of significant lncRNAs for a drug while the magenta bars indicate the number of lncRNAs that are statistically significant after adjusting for the expression levels of every cis-PCG (within 1 Mb) of the lncRNA transcript. The piechart below shows biotype distribution of the lncRNAs in the cohort of significant drug–lncRNA pairs adjusted for cis-PCGs. (B) Ideogram of the human chromosomes displaying the top lncRNA and PCG associated with each CTRP drug. P values of the drug–gene associations are indicated as red bars for lncRNAs above the chromosomes and as blue bars for PCGs below the chromosomes at their respective locus. The yellow highlighted boxes indicate the cytobands with overlapping top lncRNA and PCG loci associated with a drug. Bolded letters (red = lncRNA, blue = PCG) indicate signals associated with the set of drugs with clinically actionable biomarkers. (C) Examples of top lncRNA associated with veliparib and idelalisib response, with black bars indicating adjusted P values for lncRNA and cis-PCGs.

