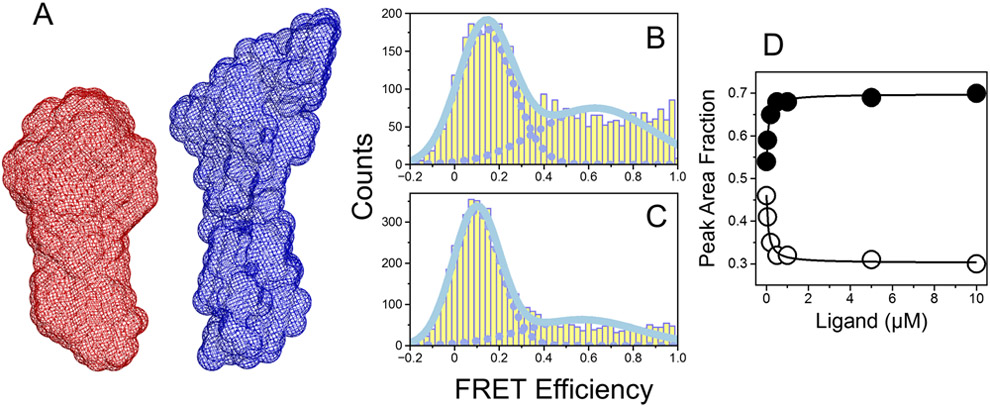
Figure 1A-D.
Solution structures of prothrombin and Mz revealed by SAXS and smFRET measurements. (A) Reconstructed 3D envelopes of prothrombin (red) and Mz (blue) calculated from their respective scattering profiles. The maximal particle sizes (Dmax) for prothrombin and Mz calculated from the pair distance distribution functions (not shown) are 120 Å and 160 Å, respectively. FRET efficiency histogram of Mz S525A labeled with the AF555/AF647 fluorophores at positions S120C/S478C measured in the (B) absence or (C) presence of saturating concentrations of H-D-Phe-Pro-Arg-p-nitroanilide (FPR). (D) Fractions of Mz molecules populating either the open (closed circles) or closed (open circles) conformations calculated at different concentrations of FPR. The Kd value for the interaction of Mz with FPR obtained from fitting the data into a single site model was 90±10 nM.

