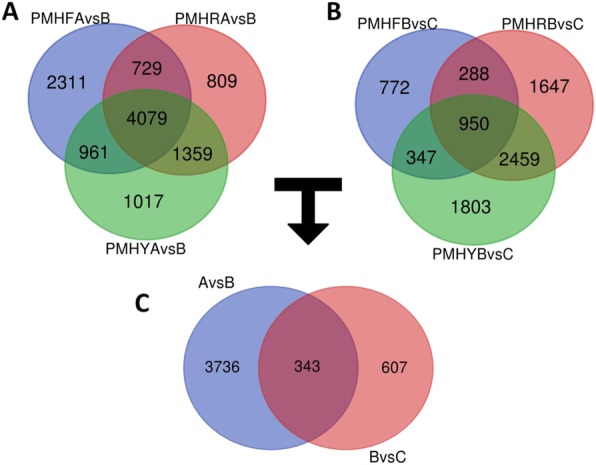
Fig. 3.

Differential expressed genes (DEG) during fruit developmental stages in Prunus mira. a. Venn diagram showing the shared and unique DEGs between pit-hardening (A) and cell enlargement (B) stages in PMHF, PMHR and PMHY; b. Venn diagram showing the shared and unique DEGs between cell enlargement (B) and fruit ripening (C) stages in PMHF, PMHR and PMHY; c. Venn diagram showing the shared and unique DEGs between the transitions from A to B and B to C
