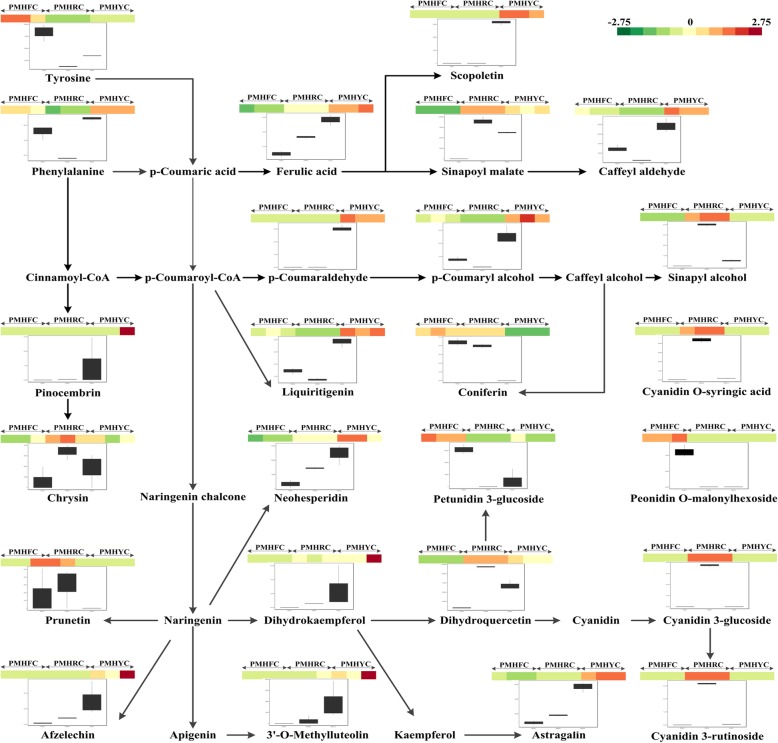
Fig. 8.
Overview of the phenylpropanid-flavonoid biosynthetic pathway during the fruit ripening stage in 3 Prunus mira fruit types (PMHF, PMHR and PMHY). Color scale from dark green to dark red for the heatmap represents the log2 value of the metabolite content. The boxplots based on 3 biological replicates show the variation of the metabolite contents in the 3 fruit types

