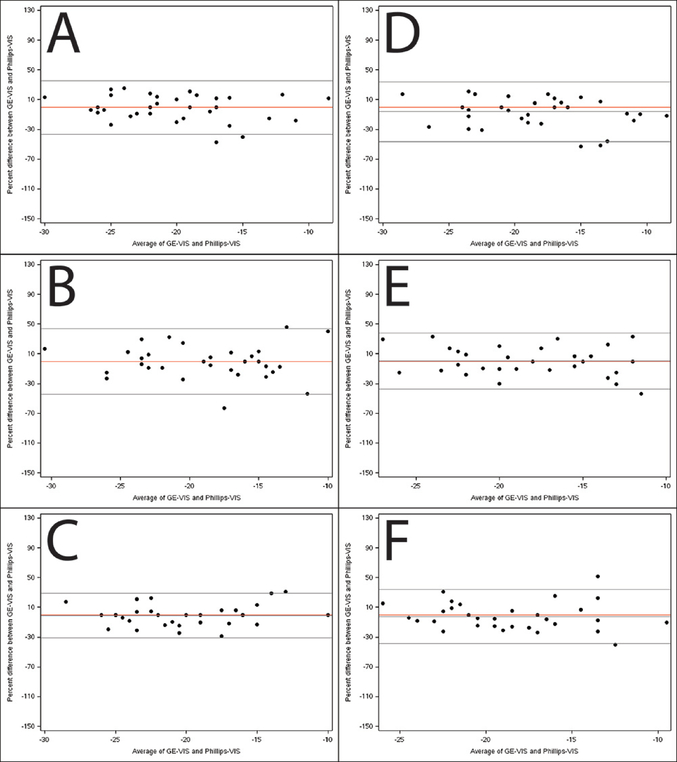
Figure 3. Bland-Altman plots illustrating agreement between global strain measured by vendor-independent software (TomTec) on images acquired by the GE and Philips scanners.
Percentage difference is the difference between GE-VIS and Philips-VIS divided by the mean of the paired measurements. Panels A-C depict agreement between the TomTec length of line global strain measurements (2, 3, and 4 chamber respectively) and panels D-F depict agreement between the TomTec average global strain measurements. The middle black line depicts the average % difference and the outer lines depict the 95% limits of agreement. The red line is a reference for zero bias.

