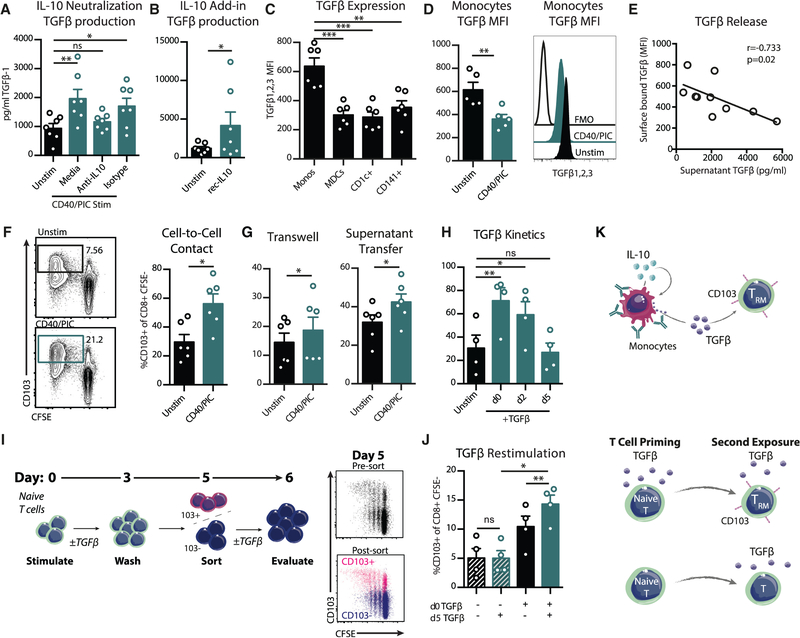
Figure 4. IL-10 Stimulates the Release of Monocyte TGF-β and TRM Priming.
(A and B) TGF-β1 levels in supernatants of stimulated blood APC cultures after 6 h with anti-IL10 (A) or recombinant IL-10 (B) (n = 7). (C and D) Surface expression of TGF-β1, TGF-β2, and TGF-β3 after 6 h in culture unstimulated (C) or stimulated (D) (n = 6).
(E) Correlation of secreted TGF-β1 (x axis) and monocyte TGF-β MFI (y axis) (n = 5).
(F) Purified CD14+ monocytes were cultured with CFSE-labeled allogenic naive T cells (n = 6).
(G) Purified CD14+ monocytes were cultured in a transwell assay with CFSE-labeled naive T cells stimulated with CD3-CD28 beads, or supernatants were transferred from monocytes after overnight stimulation. Frequency of proliferating CD8 T cells expressing CD103 is shown (n = 6).
(H–J) Naive CFSE-labeled T cells were stimulated with CD3-CD28 beads (n = 4). (H) Cultures were supplemented with TGF-β1 on day 0, 2, or 5 of the culture and evaluated for CD103 on day 6. (I) Experimental setup. T cells were cultured in the presence or absence of TGF-β1. Cells were washed on day 3 with fresh media and sorted for CD103− cells on day 5. CD103− cells were restimulated with TGF-β1 and evaluated for CD103 expression on day 6. Shown are representative plots of CD103 sorting purity of CD103+ (pink) and CD103− (blue) fractions on day 5 and (J) summary of CD103 expression on day 6 of cultures. Each data point represents a separate human donor (mean ± SEM).
(K) Graphical summary of findings.
Significance was tested using an unpaired Student’s t test (B, D, F, and G), one-way ANOVA (A, C, H, and J), or Spearman’s test (E). See also Figure S4.

