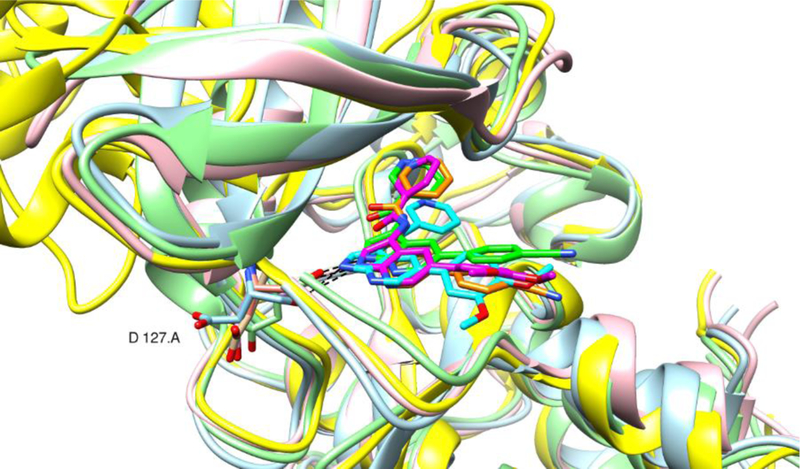
Figure 11.
AAK1 snapshot structures with 3 ligands. Compound 1 (green, lightgreen), compound 8g (magenta, rose) and compound 21b (cyan; lightblue), taken extracted from the last 4 ns of the MD trajectory as representative structure from the biggest cluster using the average linkage clustering method available in cpptraj. The AAK1 and lkb X-ray structures are also shown (orange, yellow). Image made by the Chimera software.45

