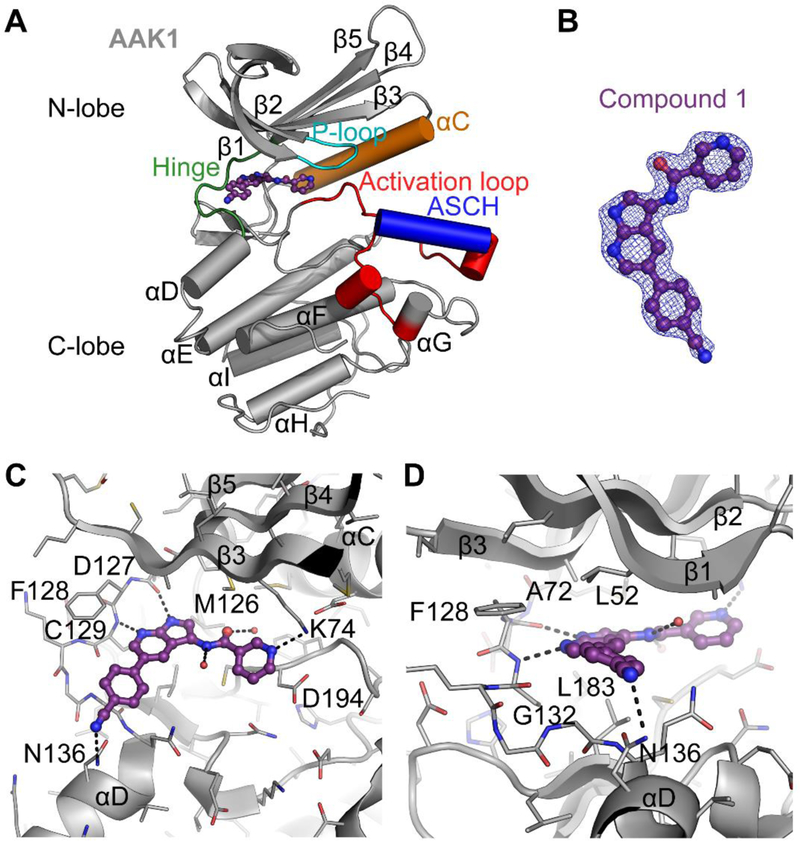
Figure 5.
Crystal structure of AAK1 (grey) in complex with compound 1 (purple), PDB ID 5L4Q. A: Overview of the crystal structure of AAK1. Highlighted are areas that are important for kinase function. Compound 1 bound at the hinge is shown. ASCH = Activation Segment C-terminal Helix, a feature unique to kinases of the NAK family. B: 2Fo-Fc Electron density map contoured at 1σ around compound 1, showing the fit of the model to the map. C and D: Detailed views of the interactions of compound 1 in the ATP-binding site from two orientations. Black dotted lines indicate polar interactions, red spheres indicate water molecules. Note that residues 48–63 from β1 and β2 are removed from C for clarity.

