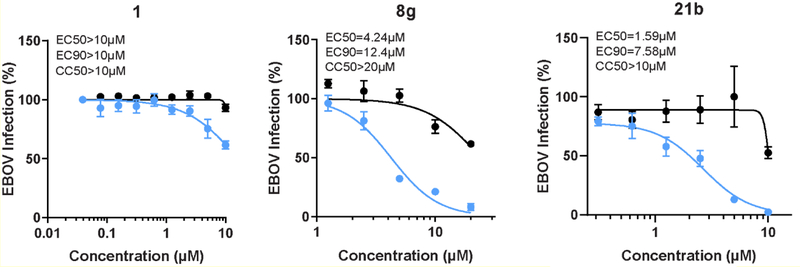
Figure 7. Compounds 1, 8g and 21b suppress EBOV infection.
Dose response of EBOV infection (blue) and cell viability (black) to compounds 1, 8g and 21b measured by plaque assay (for compound 1) or immunofluorescence assays (for compounds 8g and 21b) and CellTiter-Glo luminescent cell viability assay in Huh7 cells 48 hours after infection. Data are plotted relative to vehicle control. Shown are representative experiments from at least two conducted, each with 3 biological replicates; shown are means ± SD.

