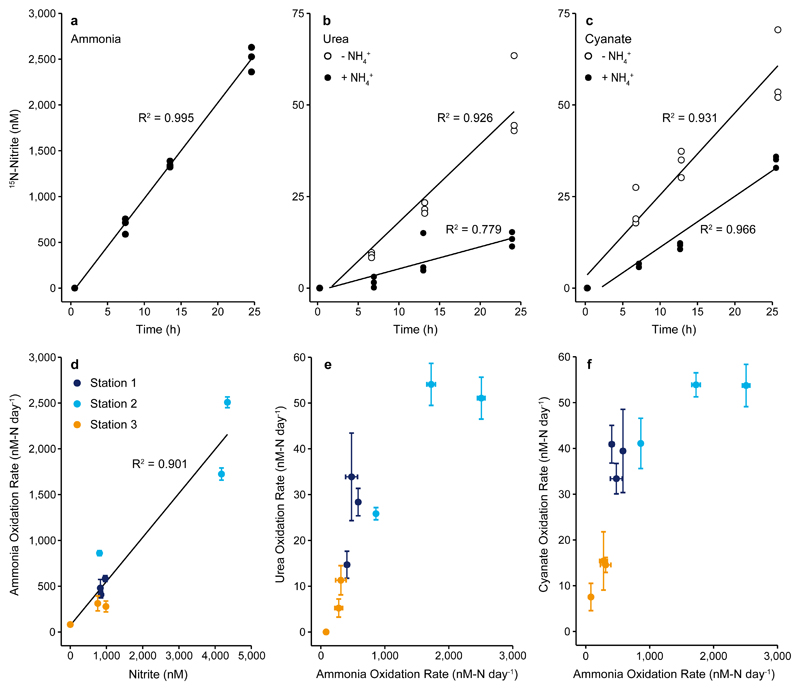
Fig. 2. Production of 15N-nitrite over time and correlations between rates obtained from various substrate additions.
Upper panels: 15N-nitrite concentration over time after addition of a) 15N-ammonium, b) 15N-urea, and c) 15N-cyanate without (open circles) and with (filled circles) added 14N-ammonium (5 μM) at Station 2, 14 m depth. Data points represent biological triplicates. Lower panels: Correlations between d) ammonia oxidation rate and in-situ nitrite concentration, e) ammonia oxidation rate and urea-derived oxidation rate, and f) ammonia oxidation rate and cyanate-derived oxidation rate (from incubations without added 14N-ammonium). Black lines in panels a) – d) are linear regressions, R2 was calculated based on Pearson Correlations, and was significant in all analyses (a-c), one-sided t-test; a) t = 42.66, DF = 10, p = 1.20×10⁻¹³, b) t = 11.184, DF = 10, p = 5.65×10⁻⁷ and t = 5.931, DF = 10, p = 1.45×10⁻⁴ for urea without and with added ammonium, respectively, c) t = 11.634, DF = 10, p = 3.91×10⁻⁷ and t = 16.935, DF = 10, p = 1.08×10⁻⁸ for cyanate without and with added ammonium, respectively, d) two-sided t-test; t = 8.002, DF = 7, p = 9.10×10⁻⁵. For panels e) and f), Spearman rank correlations were calculated and were significant for both e) S = 10, ρ = 0.917, p = 0.001 and f) S = 10, ρ = 0.917, p = 0.001. Error bars in panels (d-f) represent standard errors of slopes calculated across all biological triplicates and all timepoints.

