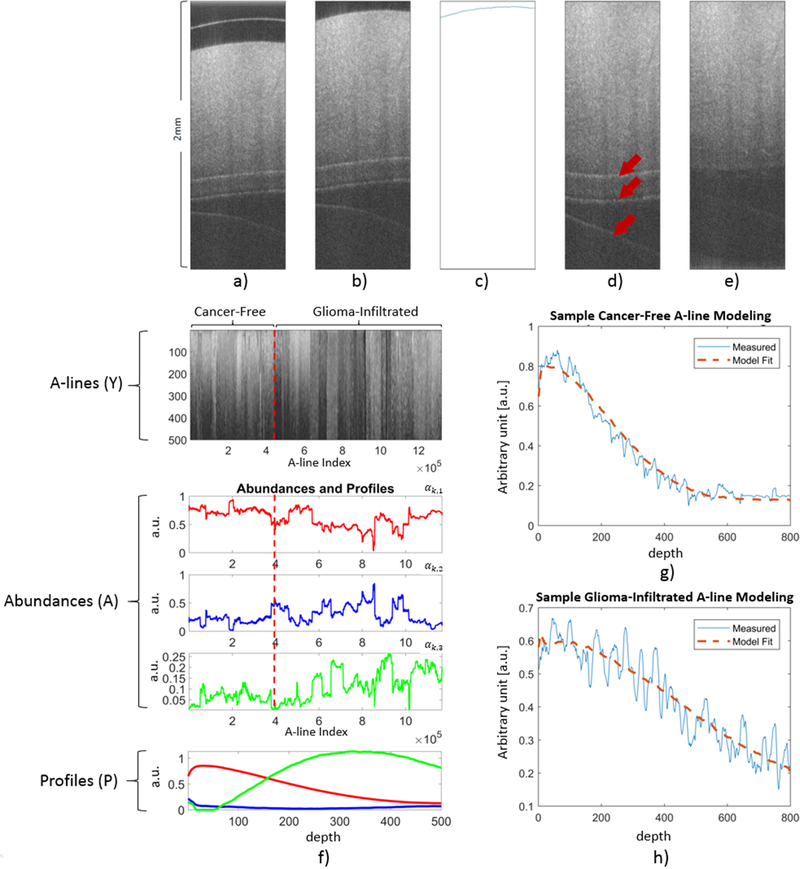
Figure 1 –
Preprocessing steps applied to every B-scan in both the training and validation sets. a) Unprocessed B-scan. b) Cropped B-scan. c) Surface detection using the Canny Edge Detection algorithm. d) Warped B-scan to generate a flat surface. Arrows indicate reflection artifacts. e) Peak detection to identify locations of reflection artifacts, and entropy filtering around the detected peaks to obtain a completely preprocessed B-scan. f) Results of the BEAE analysis applied to the training set. Top panel: All the A-lines (Y) from the training set included in the BEAE analysis. Middle panels: Estimated abundances (A) for each A-line analyzed. Bottom panel: Estimated profiles (P) common to all the A-lines included in the BEAE analysis. g) Sample A-line from a non-cancerous volume and its fit modeled as the linear combination of the estimated common profiles (P). h) Sample A-line from a glioma-infiltrated volume and its fit modeled as the linear combination of the estimated common profiles (P).

