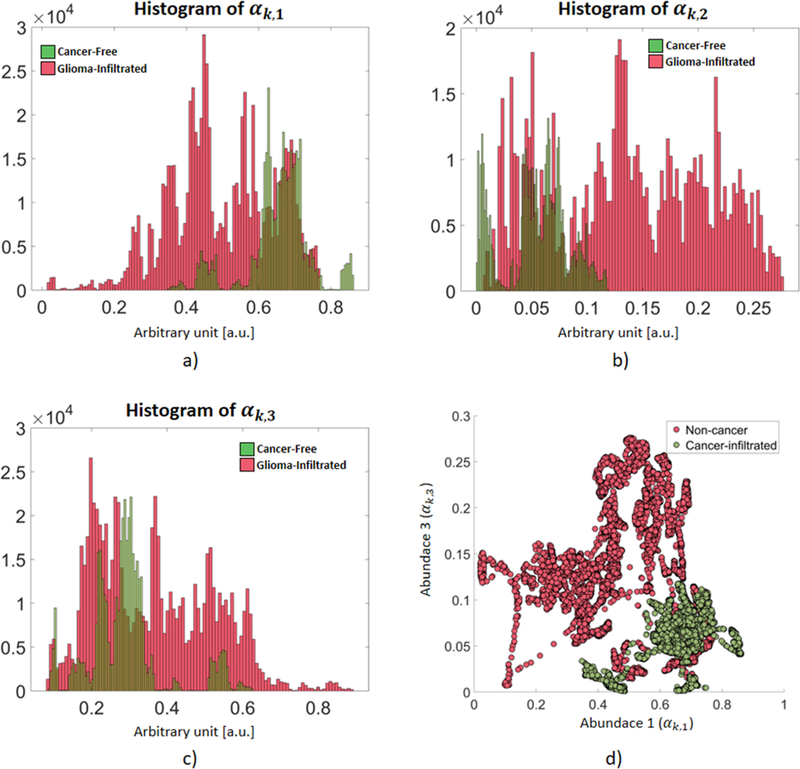
Figure 2 –
Distributions of the three abundances of the non-cancerous and glioma-infiltrated A-lines in the training set. a) The first abundance (αk,1) is distributed at lower values for the glioma-infiltrated A-lines. b) The distribution of the second abundance (αk,2) roughly mirrors that of the first abundance. c) The third abundance (αk,3) is distributed at higher values for the glioma-infiltrated A-lines. d) Distributions of the feature vectors xk = [αk,1, αk,3] for the non-cancerous and glioma-infiltrated A-lines (only 0.02 % of the total training set is shown for clarity).

