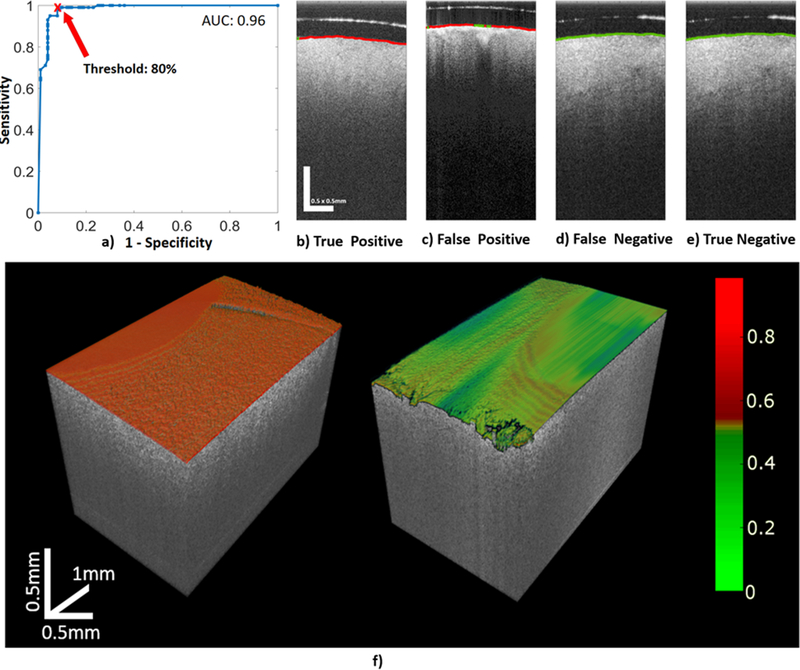
Figure 3 –
a) Results of the ROC analysis performed on the training set to select the threshold in the volume percentage of A-lines classified as from a glioma-infiltrated region used to classify the whole volume as either from a non-cancerous or a glioma-infiltrated region. The AUC=0.96 indicates a very promising classification performance. A threshold of 80% was selected in order to maximize the sensitivity (99.15%) at the best specificity level possible (86.21%) for classifying volumes from a glioma-infiltrated region. Sample classified B-scans from the validation set, in which the surface was color-coded based on each A-line classification (red: glioma-infiltrated; green: non-cancerous): b) True Positive, c) False Positive, d) False Negative, and e) True Negative. f) Sample OCT 3D rendered images of brain regions in which the surface of the imaged brain tissue is color-coded using a colormap proportional to the estimated post-probability of each A-line being from a glioma-infiltrated brain region. For the sample OCT volume of a glioma-infiltrated brain region (left panel), 100 % of the A-lines were correctly classified as from glioma-infiltrated brain region. For the sample OCT volume of a non-cancerous brain region (right panel), 92 % of the A-lines were correctly classified as from non-cancerous brain region.

