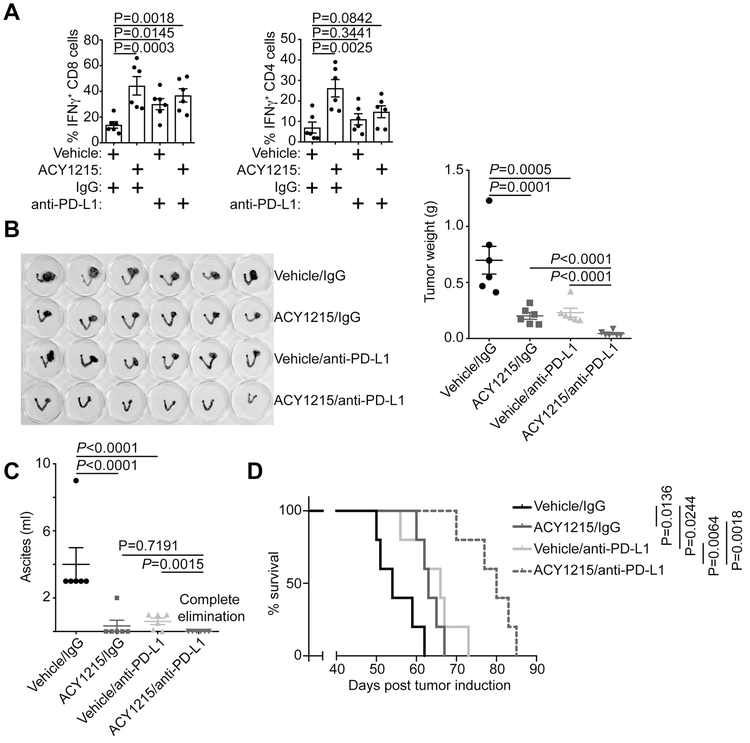
Figure 3. ACY1215 and anti-PD-L1 are synergistic in limiting tumor progression in vivo.
(A) ARID1Aflox/flox/PIK3CAH1047R OCCCs were induced by intrabursal adenovirus-encoded Cre injection and allowed to establish for four weeks. The mice were randomized into 4 indicated treatment groups and treated for an additional three weeks. At the end of treatment, percentage of IFNγ positive CD8 and CD4 T cells was assessed by flow cytometry in the peritoneal wash. (B) 6 mice from each of the indicated groups were euthanized after treatment. Images of dissected reproductive tracks with tumors were shown in the left panel. The weights of the dissected tumors were quantified as a surrogate for tumor burden on the right. (C) Same as (B), but quantified for the ascites produced. (D) After completing treatment, the mice were followed for survival and shown are the Kaplan–Meier survival curves for each of the indicated groups. Error bars represent ± S.E.M.

