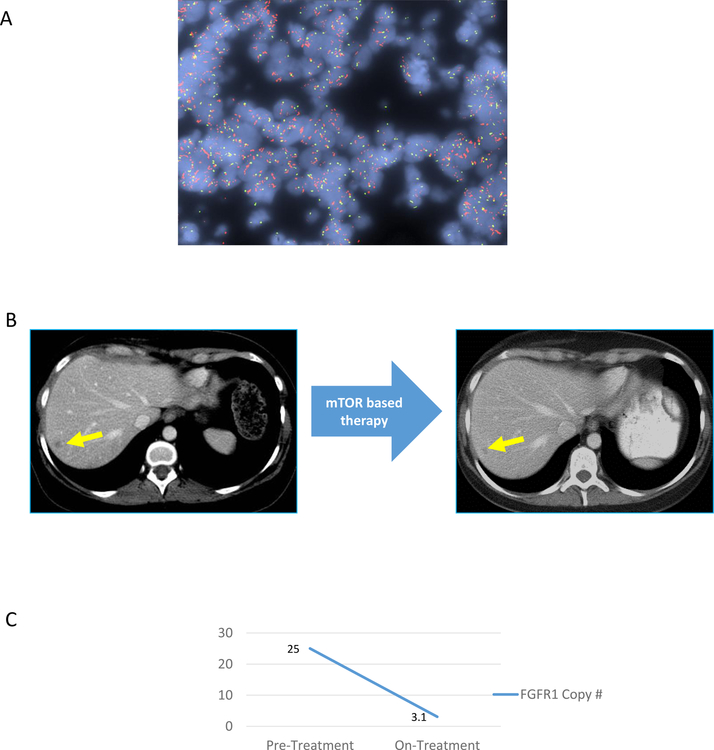
Figure 3. Radiological and molecular response with mTOR based therapy in an index patient with FGFR1 amplified metastatic breast cancer.
2A) Restaging CT scan obtained before and during treatment with endocrine therapy in combination with CDK 4/6 inhibitor and mTOR inhibitor, in an index patient with FGFR1 amplified metastatic breast cancer. Target lesions in liver are indicated with yellow arrow.
2B) Changes in the FGFR1 copy number based on cfDNAbefore and during treatment with endocrine therapy in combination with CDK 4/6 inhibitor and mTOR inhibitor, in an index patient with FGFR1-amplified metastatic breast cancer.
2C) FGFR1 FISH of primary tumor tissue. The FGFR1 probe is in red, with control probe (centromere 8) in green.

