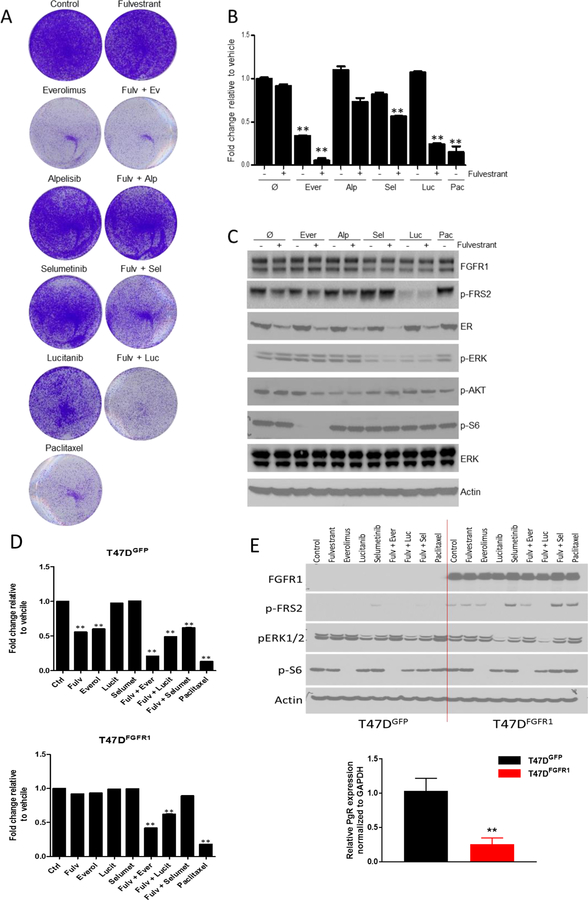
Figure 4.
4A-B) Growth inhibition of ER+/FGFR1 amplified CAMA-1 breast cancer cells by various inhibitors. Representative images (A) and quantification (B) of integrated intensity are shown (**, P < 0.01 vs. control, t test).
4C) Pharmacodynamic impact on cell-signaling in ER+/FGFR1 amplified CAMA-1 breast cancer cells by various inhibitors. Immunoblot analysis with the indicated antibodies of lysates treated for 6 hours with vehicle, fulvestrant, everolimus, alpelisib, selumetinib, lucitanib, paclitaxel and the combination in 10% DMEM-FBS plus 2ng/mL FGF2.
4D) Growth inhibition of ER+ T47D cells with a FGFR1 expression vector by various inhibitors. Representative images (A) and quantification (B) of integrated intensity are shown (**, P < 0.01 vs. control, t test).
4E) Pharmacodynamic impact on cell-signaling in ER+ T47D cells with a FGFR1 expression vector by various inhibitors. Immunoblot analysis with the indicated antibodies of lysates treated for 6 hours with vehicle, fulvestrant, everolimus, alpelisib, selumetinib, lucitanib, paclitaxel and the combination in 10% DMEM-FBS plus 2ng/mL FGF2. PR mRNA levels from T47D cells with/without a FGFR1 expression vector were analyzed by qRT-PCR.

