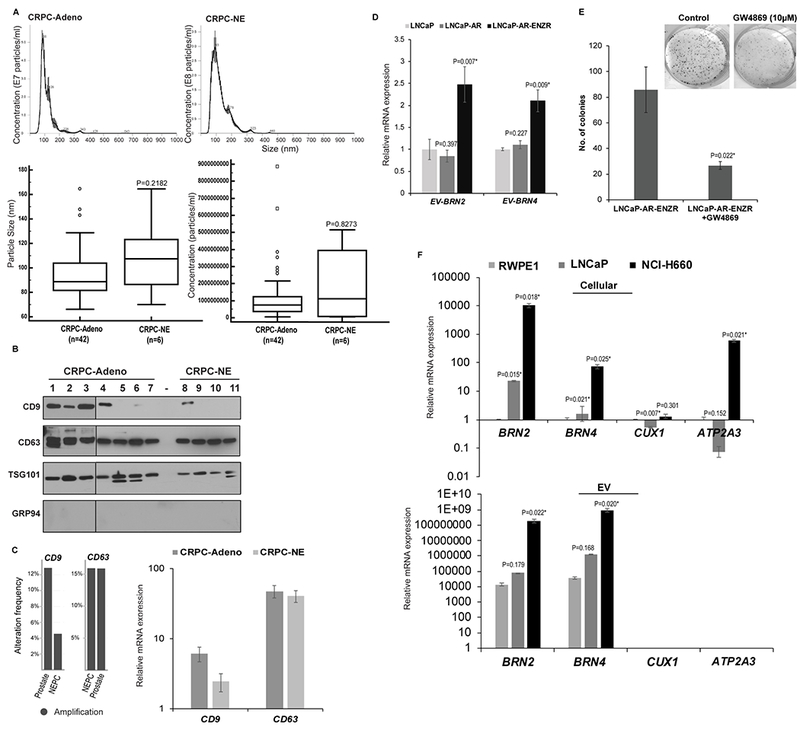
Fig. 4. Alterations in EV secretion pathways upon induction of neuroendocrine differentiation states in prostate cancer and release of BRN2 and BRN4 mRNA in PCa EVs upon ENZ treatment.

A. EVs were isolated from sera of PCa patients with CRPC-Adeno, n=42 and CRPC-NE, n=6. Nanoparticle Tracking Analyses (NTA) of representative CRPC-Adeno (upper left panel) and CRPC-NE (upper right panel) cases showing size and concentration of isolated particles. Lower left: Average particle size and; Lower right: Particle concentration in CRPC-Adeno vs CRPC-NE cases as determined by NTA analyses.
B. Western blot analyses for EV markers CD9, CD63, TSG101 and negative marker GRP94 to confirm the integrity of EVs isolated from sera of CRPC-Adeno (n=7) and CRPC-NE (n=4) cases.
C. Genomic alteration frequencies (left panel) and relative mRNA expression (right panel) for CD9 and CD63 in CRPC-Adeno and CRPC-NE cases in Beltran et al (11) cohort. mRNA data is represented as mean ± SEM.
D. EVs were extracted from conditioned media of LNCaP, LNCaP-AR and ENZ-R cell line followed by RNA isolation and real-time PCR based expression profiling for EV-associated BRN2 and BRN4 mRNA. Data were normalized to GAPDH control and represented as mean ± SEM.
E. LNCaP-AR ENZR cell line was treated with exosome inhibitor GW4869 (20µM) for 48 hours followed by clonogenicity assay. Representative images from control/GW4869 treated cells are shown above.
F. Expression of indicated genes in cellular (upper) and EV (lower) fractions from RWPE-1, LNCaP and NCI-H660 cells. Data were normalized to GAPDH control and represented as mean ± SEM.
