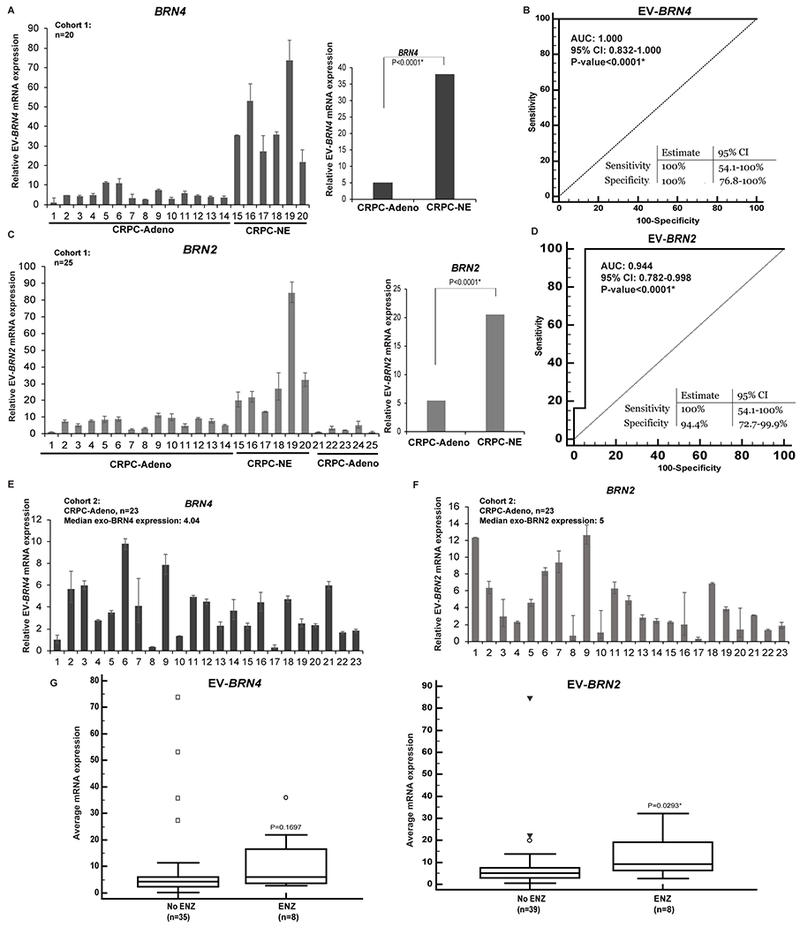
Fig. 5. EV-associated BRN4 and BRN2 are upregulated in sera from neuroendocrine PCa patients and can predict NED induction in PCa patients non-invasively.

A. Relative EV-BRN4 levels in CRPC-Adeno (n=14) and CRPC-NE samples (n=4) as assessed by real-time PCR. Data were normalized to GAPDH control and represented as mean ± SEM (left). Average EV-BRN4 expression in CRPC-Adeno vs CRPC-NE cases (right).
B. Receiver Operating Characteristic (ROC) curve analyses for EV-BRN4 as a parameter to discriminate between non-NE and NE cases based on dCt values in CRPC-Adeno vs CRPC-NE cases.
C. Relative EV-BRN2 levels in CRPC-Adeno (n=19) and CRPC-NE samples (n=4) as assessed by real-time PCR (left). Average EV-BRN2 expression in CRPC-Adeno vs CRPC-NE cases (right). Data were normalized to GAPDH control and represented as mean ± SEM.
D. ROC curve analyses for EV-BRN2 based on dCt values in CRPC-Adeno (n=19) and CRPC-NE (n=4).
E. Relative EV-BRN4 levels and,
F. EV-BRN2 levels in sera of cohort 2 of CRPC-Adeno patients (n=23) as assessed by real-time PCR. Data were normalized to GAPDH control and represented as mean ± SEM.
G. Median EV-BRN4 (left panel) and EV-BRN2 expression (right panel) in CRPC-Adeno cases treated with/without ENZ. P-values are based on Mann-Whitney U test.
