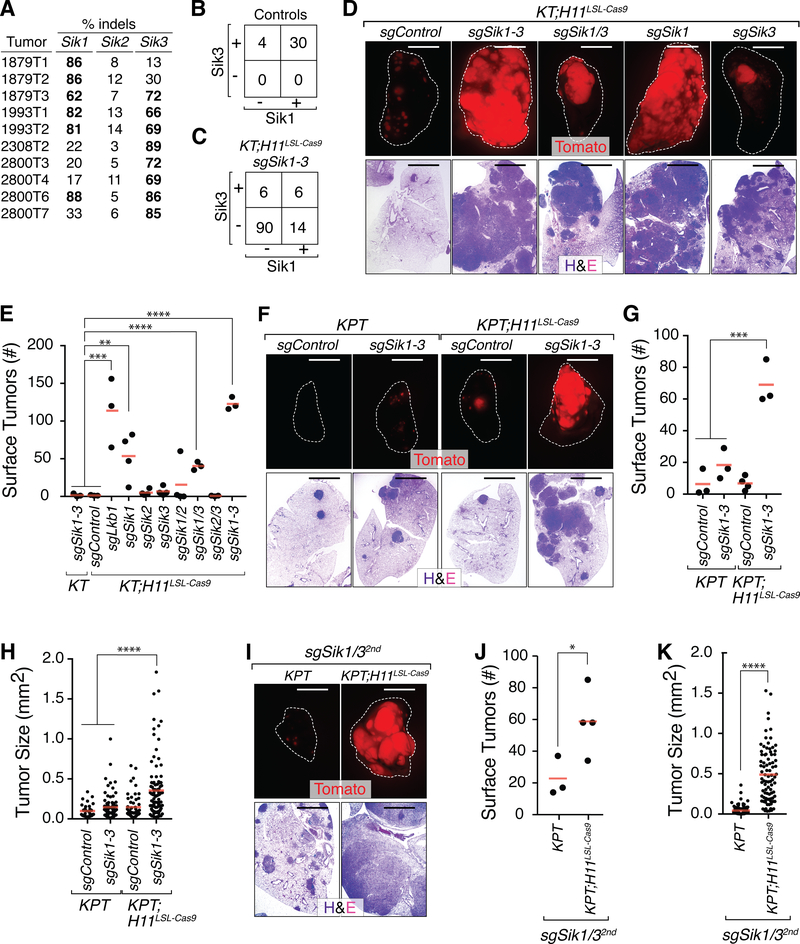
Figure 2. Sik1 and Sik3 constrain lung tumor growth in vivo.
A. Percent indels at the target sites in Sik1, Sik2, and Sik3 in cancer cells sorted from individual Lenti-sgSik1–3/Cre-initiated tumors from KT;H11LSL-Cas9 mice.
B,C. Immunohistochemistry for Sik1 and Sik3 on tumors from Control mice (KT mice with Lenti-sgSik1–3/Cre-initiated tumors and KT;H11LSL-Cas9 mice with Lenti-sgControl/Cre-initiated tumors; B) and KT;H11LSL-Cas9 mice with Lenti-sgSik1–3/Cre-initiated tumors (C).
D. Representative fluorescence (top) and H&E (bottom) images of lungs from KT;H11LSL-Cas9 mice after tumor initiation with Lenti-sgRNA/Cre vectors as indicated. Lung lobes are outlined with a white dashed line. Top scale bars = 5 mm. Bottom scale bars = 2 mm.
E. Number of Tomatopositive surface tumors (>1 mm in diameter) in KT and KT;H11LSL-Cas9 mice with tumors initiated with Lenti-sgRNA/Cre vectors as indicated. Each dot represents a mouse. The crossbars indicate the mean.
F, I. Representative fluorescence (top) and H&E (bottom) images of lungs from KPT and KPT;H11LSL-Cas9 mice with tumors initiated with Lenti-sgRNA/Cre vectors as indicated. Lung lobes are outlined in white. Top scale bars = 5 mm. Bottom scale bars = 2 mm.
G, J. Number of Tomatopositive surface tumors (>1 mm in diameter) in KPT and KPT;H11LSL-Cas9 mice with tumors initiated with Lenti-sgRNA/Cre vectors with the indicated sgRNAs. Each dot represents a mouse. The crossbars indicate the mean.
H, K. Tumor size as measured by histology in KPT and KPT;H11LSL-Cas9 mice with tumors initiated with Lenti-sgRNA/Cre vectors as indicated. Each dot represents an individual tumor. The crossbars indicate the mean. An independent set of sgRNAs targeting Sik1 and Sik3 was used in I, J, and K. * p-value < 0.05, ** p-value < 0.01, ***p-value < 0.001, ****p-value <0.0001.

