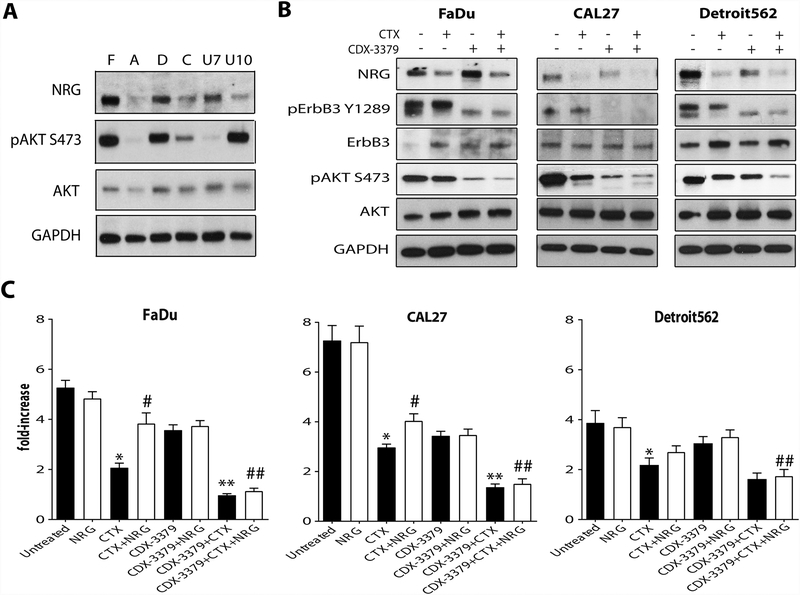
Figure 3. CDX-3379 blocks the induction of NRG/ErbB3/AKT pathway in HNSCC cell lines.
(A.) Western blots representing levels of NRG expression and AKT phosphorylation and expression in FaDu (F), A431 (A), Detroit562 (D), CAL27 (C), UNC7 (U7) and UNC10 (U10) HNSCC cell lines. GAPDH was used as a loading control. Representative data from two experiments are shown. (B.) Western blots demonstrating changes in NRG levels and ErbB3 and AKT phosphorylation and expression in FaDu, Detroit562 and CAL27 HNSCC cell lines treated with vehicle, 30 nM CTX, 50 nM CDX-3379, or both for 48 hours. GAPDH was used as a loading control. Representative data from two experiments are shown. (C.) Bar graphs representing fold increases in proliferation for FaDu, CAL27 and Detroit562 HNSCC cell lines after 5 days of drug exposure. Cultures were treated as described in Materials and Methods. The results are mean values ± standard error (SE) for three independent experiments for each cell line. An * indicates a significant difference vs untreated, an ** indicates a significant difference vs CTX, an # indicates a significant difference vs CTX alone, and an ## indicates a significant difference vs CTX + NRG (p ≤ 0.05).

