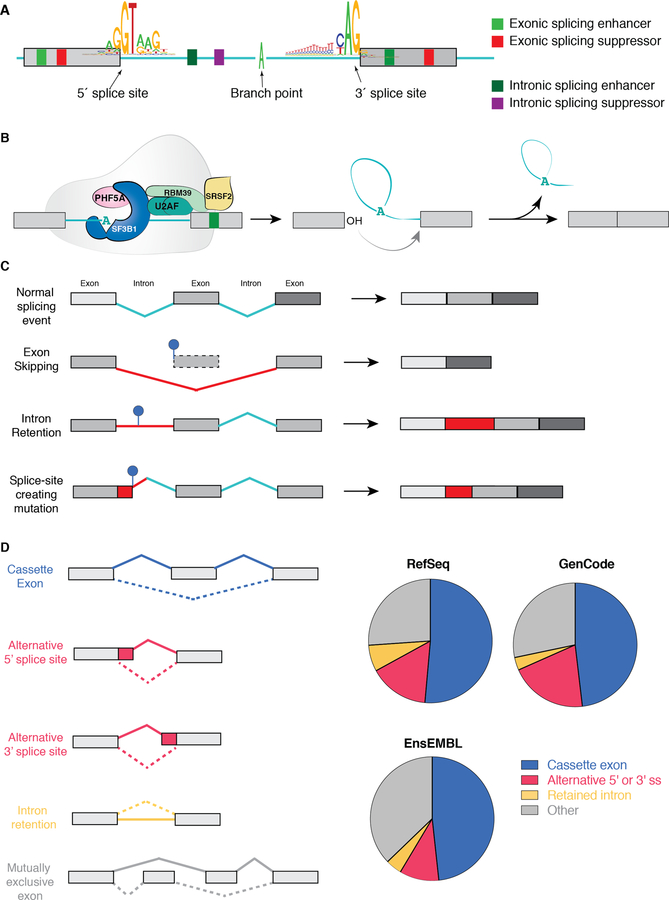
Figure 1. Fundamentals of RNA splicing and how mutations within genes alter splicing in cis.
(A) Diagram of an intron and two flanking exons with consensus sequences defining the 5’ splice site (ss), branchpoint, and 3’ ss. Colored boxes depict sequences within exons and introns that increase or decrease the likelihood of splice site recognition by RNA binding proteins (splicing enhancers or repressors, respectively). (B) Diagram of the SF3b complex of the spliceosome (which contains SF3B1), associated RNA binding proteins (the U2AF heterodimer and an accessory splicing factor RBM39) and the sequential reactions involved in removal of an intron (intron shown in teal and exons in grey). As shown, the SF3b complex is involved in recognizing the branchpoint (shown here as an adenosine nucleotide (“A”)) and is recruited to this site by the U2AF complex, which recognizes sequences at the 3’ ss. During splicing catalysis, the branchpoint A carries out a nucleophilic attack at the 5’ ss, forming a lariat, and then the 3’OH of the released 5’ exon performs a second nucleophilic attack at the last nucleotide of the intron at the 3’ ss, joining the exons and releasing the intron lariat. (C) Diagram of how single nucleotide variants near splice sites, throughout an exon, and deep within introns may disrupt splicing or generate novel aberrant splice sites in the mRNA of a gene in cis. (D) Pie charts depicting distribution of each category of splicing event shown on the left based on annotations of the human genome from RefSeq, GenCode, and EnsEMBL.(130) “Other” represents complex splicing events (>1 of the five categories found simultaneously) as well as the small proportion of splicing events represented by mutually exclusive exons.

