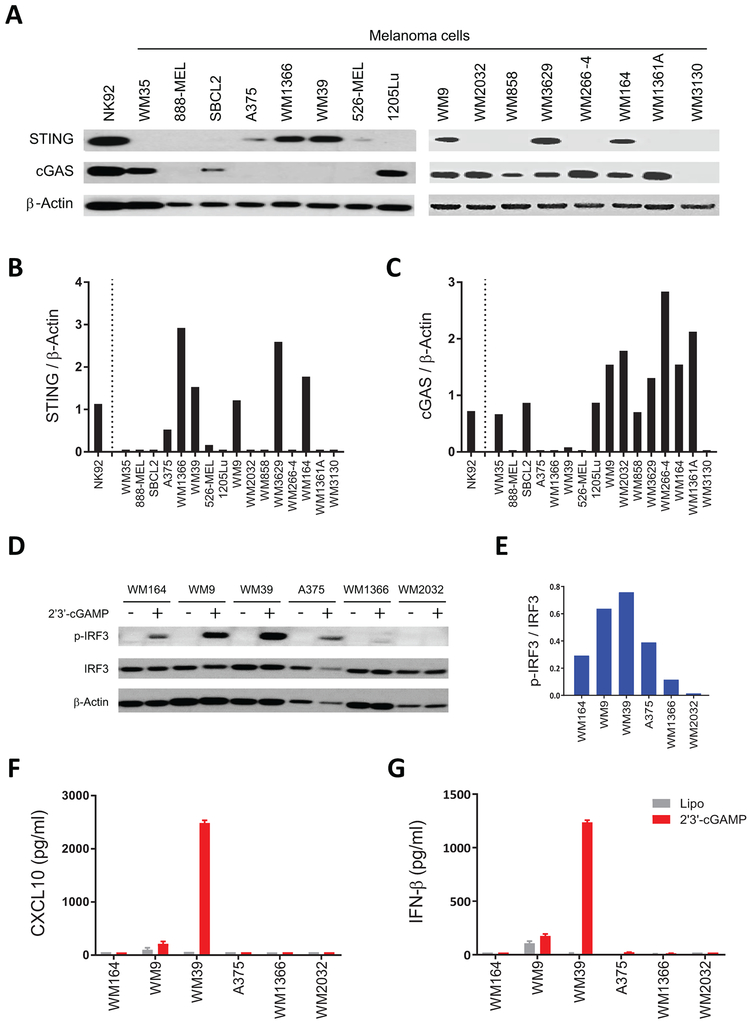
Figure 1. Identification of melanoma cell lines with intact STING signaling.
(A) Immunoblot analysis of STING and cGAS expression in a series of human melanoma cell lines. NK-92 was used as a positive control for the expression of STING and cGAS. Twenty μg of whole-cell lysate was used and β-actin was analyzed as a loading control. (B) Ratio of total STING relative to β-actin, and (C) ratio of total cGAS relative to β-actin for each cell line were quantified using ImageJ software. (D) Immunoblot analysis of p-IRF3 and total IRF3 in five STING+ (WM164, WM9, WM39, A375, and WM1366) and one STING− (WM2032) human melanoma cell lines after 4 h stimulation with 2’3’-cGAMP or lipofectamine. Twenty μg of whole-cell lysate was used and β-actin was analyzed as loading control. (E) Ratio of p-IRF3 relative to IRF-3 for 2’3’-cGAMP stimulated cell lines were quantified using ImageJ software. (F) Induction of CXCL10 and (G) IFN-β in cell culture supernatants of indicated human melanoma cells after stimulation with 2’3’-cGAMP or lipofectamine measured using ELISA and reported as mean ± SD for three biological replicates.

