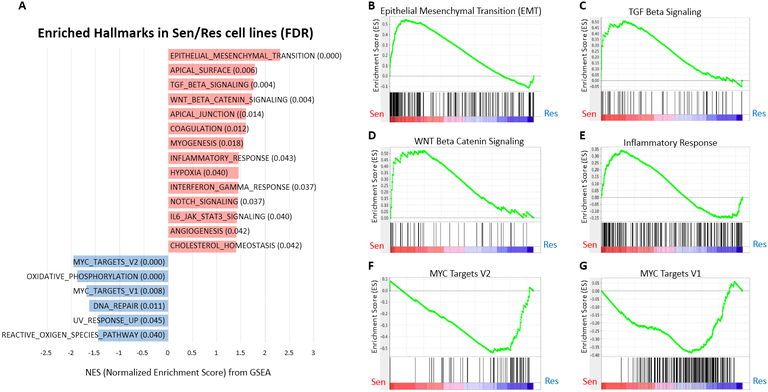
Figure 6: Gene set enrichment analysis (GSEA) according to FDR value in RX-5902 sensitive vs. resistant cell lines.
(A) GSEA was performed using baseline gene expression profiling in 14 sensitive cell lines (IC50 ≤100 nM) and 4 resistant cell lines (IC50 >100 nM) from Figure 1. Hallmark gene sets enriched in sensitive cell lines vs. resistance cell lines (FDR < 0.05). Hallmark gene sets enriched in the sensitive and resistant cell lines are highlighted in red and blue color, respectively. Selected enrichment plots for sensitive cell lines: (B) EMT, (C) TGF beta, (D) WNT/ β -catenin signaling pathway, and (E) inflammatory response. Selected enrichment plots for resistant cell lines: (F) MYC target V2 and (G) MYC target V1.

