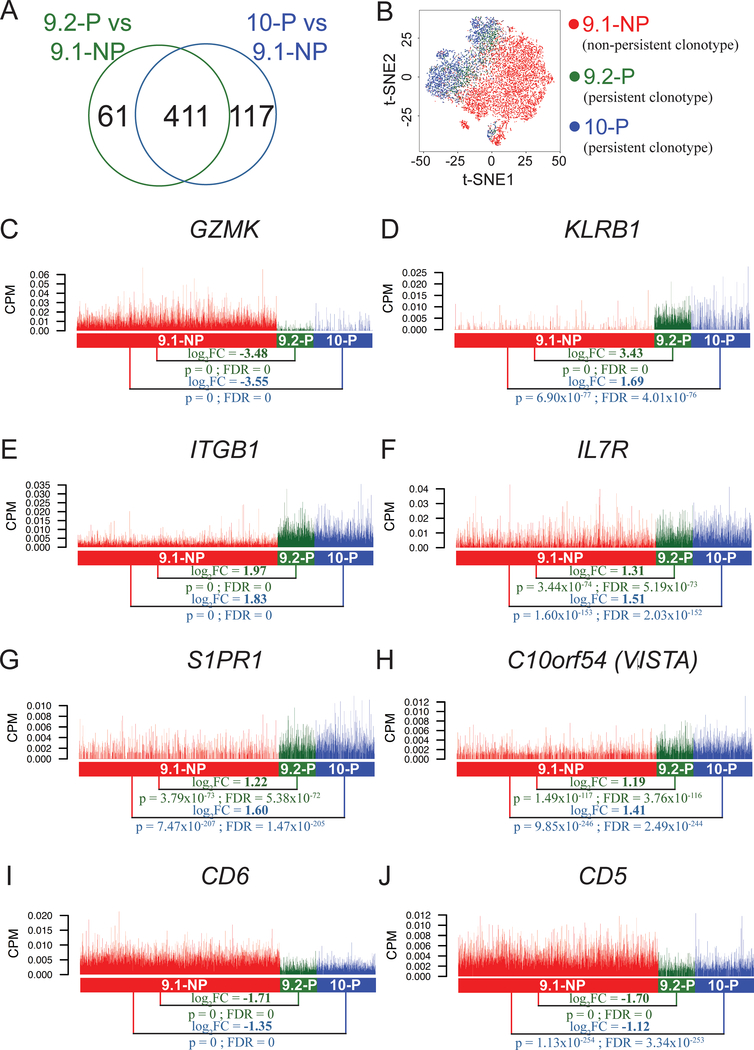
Figure 2. Differentially expressed genes encoding cell surface markers identified in the single-cell transcriptome analysis.
A, Venn diagram showing a total of 472 genes that were differentially expressed (FDR<0.05) in the comparison between 9.1-NP vs. 9.2-P single cells, and a total of 528 genes that were differentially expressed (FDR<0.05) in the comparison between 9.1-NP vs 10-P single cells. Among these genes, a total of 411 genes were shared in these two comparisons. B, The t-distributed stochastic neighbor embedding (t-SNE) plot of 9.1-NP, 9.2-P and 10-P single cells using the shared 411 genes obtained from the two comparisons. C-J, The expression of genes encoding cell surface markers are shown. Each vertical line represents a single cell. CPM: counts per million; GZMK: granzyme K; KLRB1: killer cell lectin like receptor B1; ITGB1: integrin subunit beta 1; IL7R: interleukin 7 receptor; S1PR1: sphingosine-1-phosphate receptor 1; C10orf54 (VISTA): chromosome 10 open reading frame 54 (the V domain‐containing immunoglobulin suppressor of T‐cell activation).

