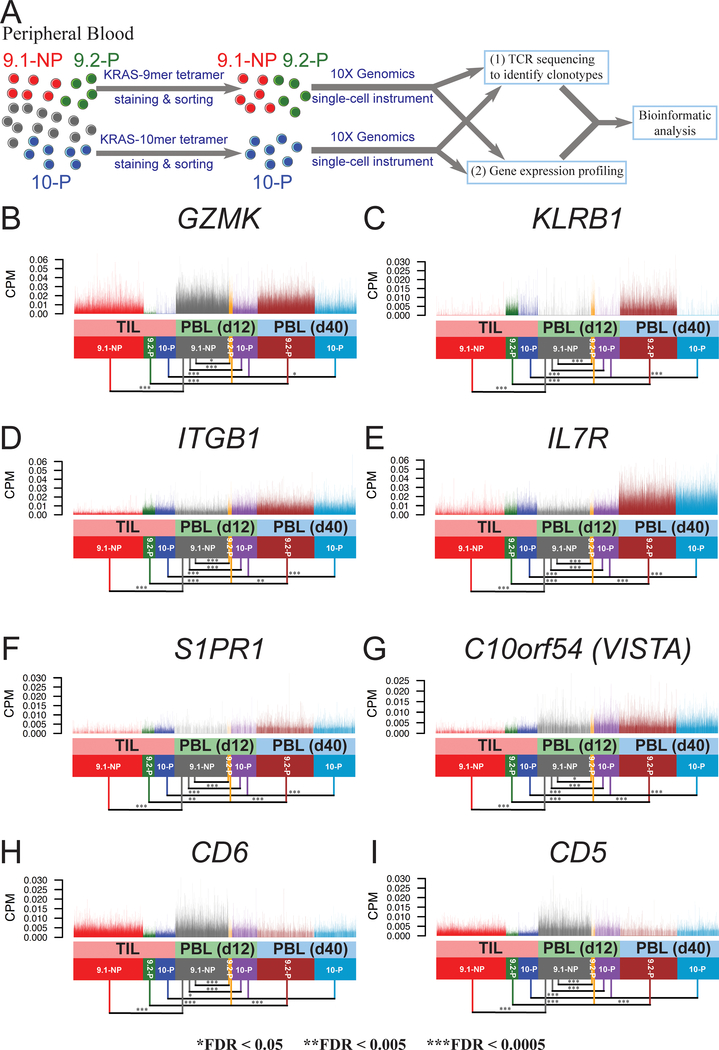
Figure 4. The gene expression of cell surface markers in 9.1-NP, 9.2-P and 10-P single cells isolated from the peripheral blood following ACT.
A, PBL samples on day 12 (d12) and day 40 (d40) were enriched by tetramer staining and sorting, followed by single-cell transcriptome analysis. B-I, The expression of genes encoding cell surface markers are shown. Single cells from TILs are plotted together with PBL samples on day 12 and day 40. Each vertical line represents a single cell.

