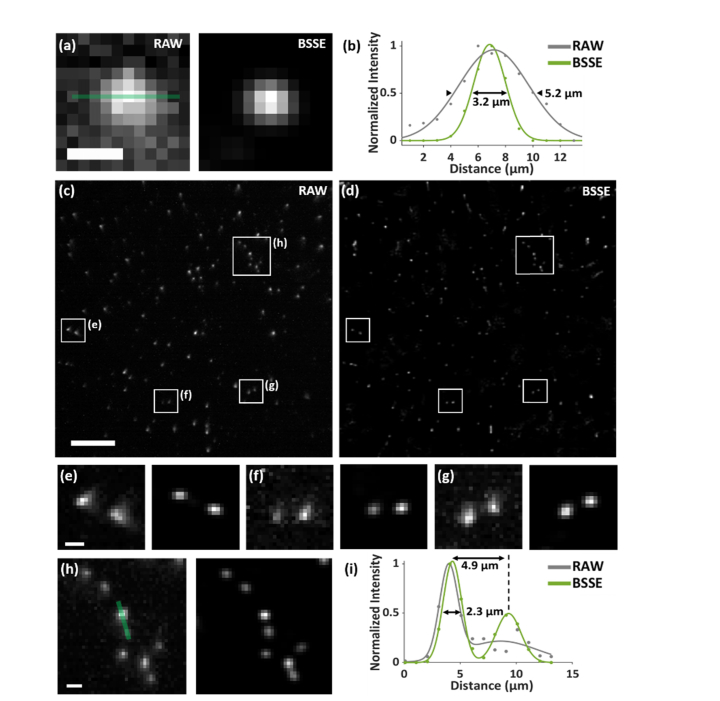
Fig. 3.
Characterization of the BSSE method. (a) Raw and BSSE-processed images of 1-µm fluorescent beads, respectively. Additional Gaussian noisy background was added to the raw image. It can be observed that the fluctuating background was substantially suppressed. (b) Gaussian fitted cross-sectional profiles along the solid line in (a) of both raw and processed images, which showed enhanced signals using BSSE. (c, d) Raw (c) and BSSE-processed (d) images of 200-nm fluorescent beads. (e-h) Zoomed-in images the corresponding boxed regions in (c, d). (i) Cross-sectional profiles with respect to the corresponding solid line in (h) in the raw and processed images, showing enhanced signals of two nearby emitters separated <5 µm. Scale bars: 5 µm (a), 50 µm (c, d), 5 µm (e-h).

