Fig. 6.
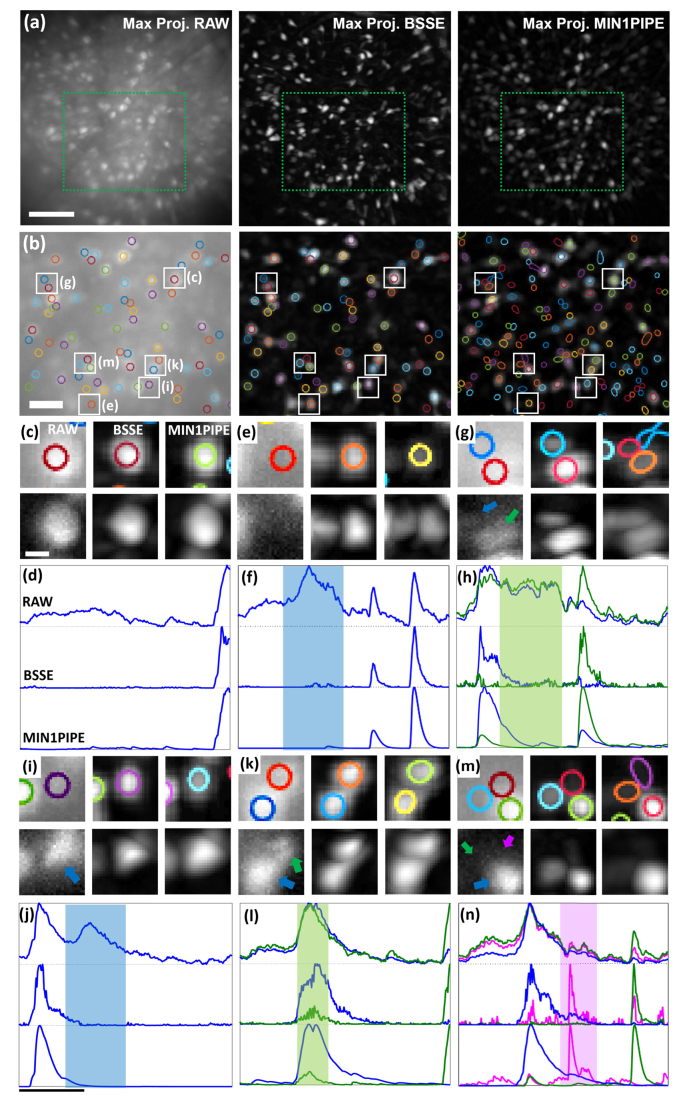
In vivo transient calcium imaging in freely behaving mice. (a) Left, example of the field of view of CA1 using the miniscope, displayed as the maximum temporal projection of fluorescence activity. Middle and right, the maximum projections of the frames individually processed by BSSE and MIN1PIPE, respectively. (b) The identified ROI contours superimposed on the corresponding boxed regions in (a), respectively. Left and middle, the contours were identified manually from the BSSE-processed data (a, middle). Right, the contours were identified using MIN1PIPE. (c,e,g,i,k,m) Six zoomed-in (top panel) and their contrast-adjusted (bottom panel) raw, BSSE-processed and MIN1PIPE-processed images of the corresponding ROI regions as marked in (b). (d,f,h,j,l,n) The corresponding normalized temporal fluorescence traces of six ROI examples as marked in (b). The shaded zones represent the false traces due to the cross-talk between neighboring neurons in the raw data, which were corrected by BSSE and MIN1PIPE. Scale bars: 100 µm (a), 50 µm (b), 10 µm (c), 5 sec (j).

